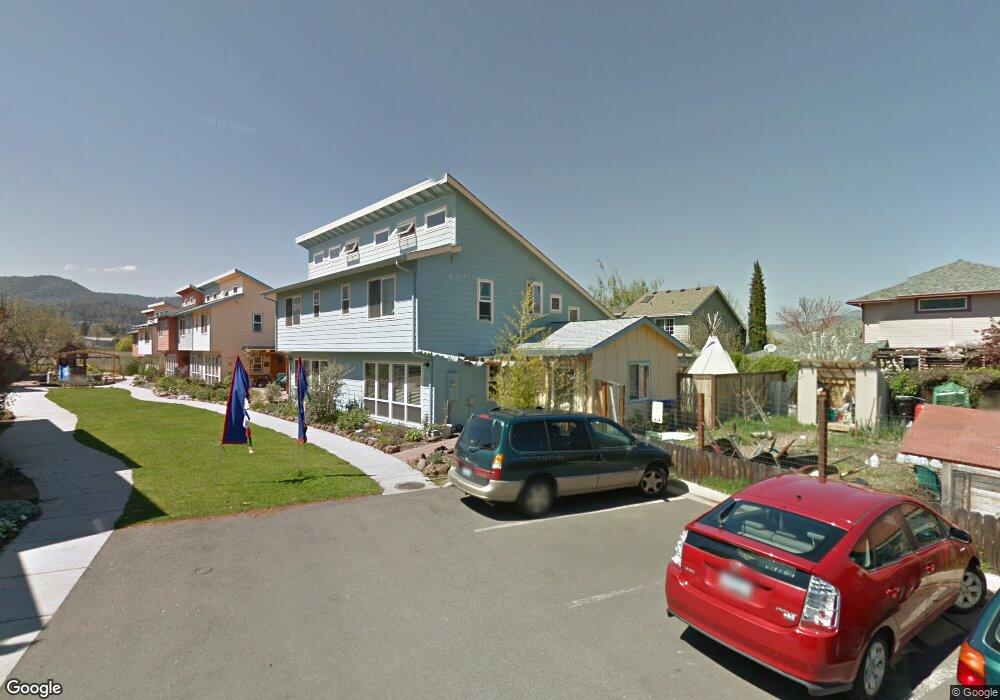
1245 Calypso Ct Ashland, OR 97520
Millpond NeighborhoodEstimated Value: $452,000 - $555,000
3
Beds
2
Baths
1,472
Sq Ft
$329/Sq Ft
Est. Value
About This Home
This home is located at 1245 Calypso Ct, Ashland, OR 97520 and is currently estimated at $483,880, approximately $328 per square foot. 1245 Calypso Ct is a home located in Jackson County with nearby schools including Walker Elementary School, Ashland Middle School, and Ashland High School.
Ownership History
Date
Name
Owned For
Owner Type
Purchase Details
Closed on
Jun 26, 2014
Sold by
Sullivan John C and Sullivan Kate
Bought by
Joshua Susan C
Current Estimated Value
Home Financials for this Owner
Home Financials are based on the most recent Mortgage that was taken out on this home.
Original Mortgage
$192,000
Outstanding Balance
$146,301
Interest Rate
4.17%
Mortgage Type
New Conventional
Estimated Equity
$337,579
Purchase Details
Closed on
Sep 6, 2007
Sold by
Fordyce Street Co Housing Community Llc
Bought by
Sullivan John C and Sullivan Kate
Home Financials for this Owner
Home Financials are based on the most recent Mortgage that was taken out on this home.
Original Mortgage
$283,500
Interest Rate
6.67%
Mortgage Type
Purchase Money Mortgage
Create a Home Valuation Report for This Property
The Home Valuation Report is an in-depth analysis detailing your home's value as well as a comparison with similar homes in the area
Home Values in the Area
Average Home Value in this Area
Purchase History
| Date | Buyer | Sale Price | Title Company |
|---|---|---|---|
| Joshua Susan C | $285,000 | Ticor Title Company | |
| Sullivan John C | $318,245 | Ticor Title |
Source: Public Records
Mortgage History
| Date | Status | Borrower | Loan Amount |
|---|---|---|---|
| Open | Joshua Susan C | $192,000 | |
| Previous Owner | Sullivan John C | $283,500 |
Source: Public Records
Tax History Compared to Growth
Tax History
| Year | Tax Paid | Tax Assessment Tax Assessment Total Assessment is a certain percentage of the fair market value that is determined by local assessors to be the total taxable value of land and additions on the property. | Land | Improvement |
|---|---|---|---|---|
| 2025 | $4,099 | $264,370 | $127,780 | $136,590 |
| 2024 | $4,099 | $256,670 | $124,050 | $132,620 |
| 2023 | $3,965 | $249,200 | $120,440 | $128,760 |
| 2022 | $3,838 | $249,200 | $120,440 | $128,760 |
| 2021 | $3,708 | $241,950 | $116,930 | $125,020 |
| 2020 | $3,604 | $234,910 | $113,520 | $121,390 |
| 2019 | $3,547 | $221,430 | $107,000 | $114,430 |
| 2018 | $3,350 | $214,990 | $103,880 | $111,110 |
| 2017 | $3,326 | $214,990 | $103,880 | $111,110 |
| 2016 | $3,240 | $202,660 | $97,920 | $104,740 |
| 2015 | $3,114 | $202,660 | $97,920 | $104,740 |
| 2014 | $3,051 | $193,450 | $92,300 | $101,150 |
Source: Public Records
Map
Nearby Homes
- 1259 Hagen Way
- 1123 Village Square Dr
- 2082 E Main St
- 65 S Mountain Ave
- 1040 E Main St
- 1245 Iowa St Unit 7
- 411 N Mountain Ave
- 496 Starflower Ln
- 753 Siskiyou Blvd
- 453 Williamson Way
- 124 Morton St
- 533 N Mountain Ave
- 557 N Mountain Ave
- 811 Iowa St
- 586 B St
- 545 A St
- 770 Iowa St
- 401 Clinton St
- 391 Clinton St Unit 5200
- 381 Clinton St Unit 5200