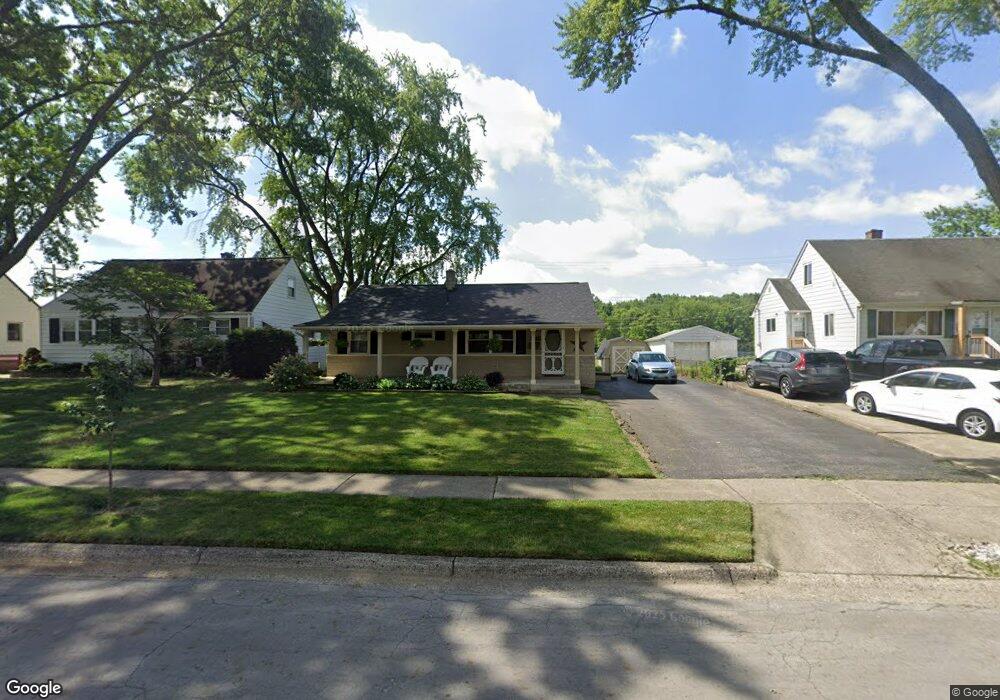
1245 Carbone Dr Columbus, OH 43224
Clinton Estates NeighborhoodEstimated Value: $206,464 - $266,000
3
Beds
1
Bath
1,026
Sq Ft
$239/Sq Ft
Est. Value
About This Home
This home is located at 1245 Carbone Dr, Columbus, OH 43224 and is currently estimated at $244,866, approximately $238 per square foot. 1245 Carbone Dr is a home located in Franklin County with nearby schools including Maize Road Elementary School, Medina Middle School, and Mifflin High School.
Ownership History
Date
Name
Owned For
Owner Type
Purchase Details
Closed on
Sep 14, 2000
Sold by
First Alliance Properties Ltd
Bought by
Foster Debra A
Current Estimated Value
Home Financials for this Owner
Home Financials are based on the most recent Mortgage that was taken out on this home.
Original Mortgage
$82,500
Outstanding Balance
$28,172
Interest Rate
7.98%
Mortgage Type
Purchase Money Mortgage
Estimated Equity
$216,694
Purchase Details
Closed on
May 3, 2000
Sold by
Williams Dawson C and Estate Of Evelyn Gugel
Bought by
First Alliance Properties Ltd
Home Financials for this Owner
Home Financials are based on the most recent Mortgage that was taken out on this home.
Original Mortgage
$65,650
Interest Rate
8.37%
Purchase Details
Closed on
Mar 18, 1987
Bought by
Gugel Evelyn A
Create a Home Valuation Report for This Property
The Home Valuation Report is an in-depth analysis detailing your home's value as well as a comparison with similar homes in the area
Home Values in the Area
Average Home Value in this Area
Purchase History
| Date | Buyer | Sale Price | Title Company |
|---|---|---|---|
| Foster Debra A | $92,500 | Chicago Title West | |
| First Alliance Properties Ltd | $46,700 | Title First Agency Inc | |
| Gugel Evelyn A | -- | -- |
Source: Public Records
Mortgage History
| Date | Status | Borrower | Loan Amount |
|---|---|---|---|
| Open | Foster Debra A | $82,500 | |
| Previous Owner | First Alliance Properties Ltd | $65,650 |
Source: Public Records
Tax History
| Year | Tax Paid | Tax Assessment Tax Assessment Total Assessment is a certain percentage of the fair market value that is determined by local assessors to be the total taxable value of land and additions on the property. | Land | Improvement |
|---|---|---|---|---|
| 2025 | $3,024 | $67,380 | $19,320 | $48,060 |
| 2024 | $3,024 | $67,380 | $19,320 | $48,060 |
| 2023 | $2,985 | $67,375 | $19,320 | $48,055 |
| 2022 | $2,074 | $39,980 | $8,020 | $31,960 |
| 2021 | $2,077 | $39,980 | $8,020 | $31,960 |
| 2020 | $2,080 | $39,980 | $8,020 | $31,960 |
| 2019 | $1,956 | $32,240 | $6,410 | $25,830 |
| 2018 | $1,869 | $32,240 | $6,410 | $25,830 |
| 2017 | $1,955 | $32,240 | $6,410 | $25,830 |
| 2016 | $1,967 | $29,690 | $6,270 | $23,420 |
| 2015 | $1,785 | $29,690 | $6,270 | $23,420 |
| 2014 | $1,790 | $29,690 | $6,270 | $23,420 |
| 2013 | $928 | $31,220 | $6,580 | $24,640 |
Source: Public Records
Map
Nearby Homes
- 1130 Carbone Dr
- 4143 Karl Rd Unit 215
- 4143 Karl Rd Unit 314
- 4145 Karl Rd Unit 223
- 3941 Karl Rd Unit 133
- 3967 Karl Rd Unit 224
- 3939 Karl Rd Unit 311
- 4320 Sandy Lane Rd
- 1144 Reed Circle Dr
- 899 Meadowview Dr
- 4450 N 4th St
- 827 Inwood Place
- 4231 Glenmawr Ave Unit 233
- 991 Hidden Acres Ct Unit 991
- 4605 Glenmawr Ave
- 4615 Glenmawr Ave
- 791 Norris Dr
- 1242 Acton Rd
- 1116 Tulsa Dr
- 4795 Colonel Perry Dr
- 1239 Carbone Dr
- 1253 Carbone Dr
- 1259 Carbone Dr
- 1231 Carbone Dr
- 1248 Carbone Dr
- 1254 Carbone Dr
- 1223 Carbone Dr
- 1240 Carbone Dr
- 1265 Carbone Dr
- 1260 Carbone Dr
- 1234 Carbone Dr
- 1215 Carbone Dr
- 1273 Carbone Dr
- 1266 Carbone Dr
- 1226 Carbone Dr
- 1274 Carbone Dr
- 1249 Frisbee Dr
- 1255 Frisbee Dr
- 1220 Carbone Dr
- 1207 Carbone Dr
Your Personal Tour Guide
Ask me questions while you tour the home.