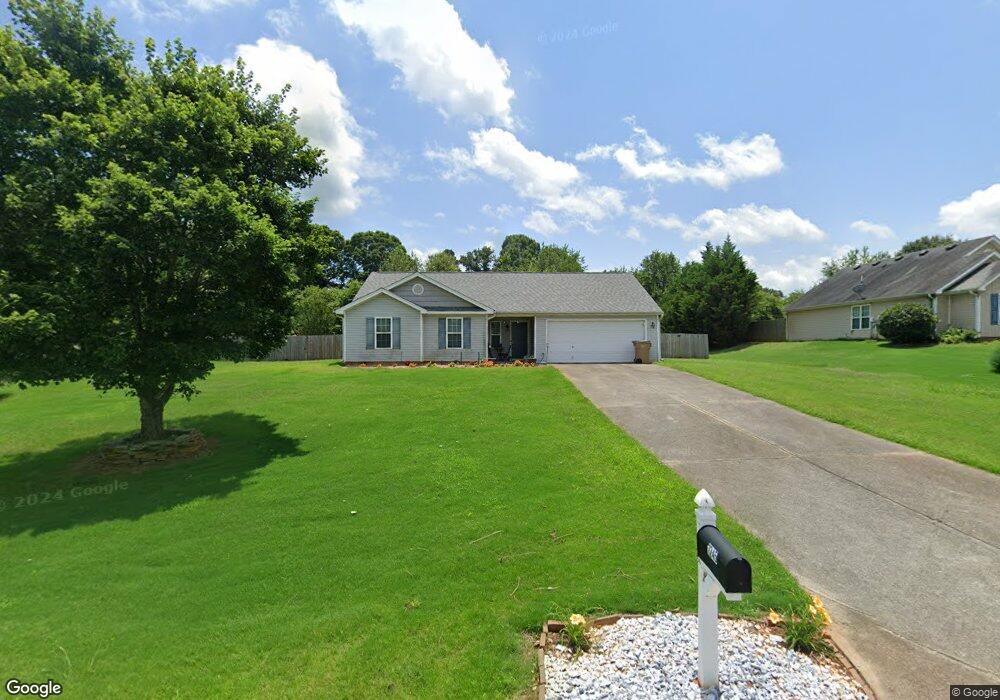
1245 Clearwater Dr Unit A Winder, GA 30680
Estimated Value: $269,000 - $305,000
3
Beds
2
Baths
1,204
Sq Ft
$242/Sq Ft
Est. Value
About This Home
This home is located at 1245 Clearwater Dr Unit A, Winder, GA 30680 and is currently estimated at $291,961, approximately $242 per square foot. 1245 Clearwater Dr Unit A is a home located in Barrow County with nearby schools including Statham Elementary School, Bear Creek Middle School, and Winder-Barrow High School.
Ownership History
Date
Name
Owned For
Owner Type
Purchase Details
Closed on
Apr 14, 2010
Sold by
Hare Aaron J and Hare Debra B
Bought by
Watkins Nikki
Current Estimated Value
Home Financials for this Owner
Home Financials are based on the most recent Mortgage that was taken out on this home.
Original Mortgage
$87,653
Outstanding Balance
$58,293
Interest Rate
4.97%
Mortgage Type
New Conventional
Estimated Equity
$233,668
Purchase Details
Closed on
May 20, 2009
Sold by
Aurora Loan Services Llc
Bought by
Hare Aaron J and Hare Debra B
Home Financials for this Owner
Home Financials are based on the most recent Mortgage that was taken out on this home.
Original Mortgage
$74,623
Interest Rate
4.8%
Mortgage Type
FHA
Purchase Details
Closed on
Jan 6, 2009
Sold by
Jett Peggy E
Bought by
Aurora Loan Services Llc
Purchase Details
Closed on
Oct 15, 2004
Sold by
Pwl Co Inc
Bought by
Rural American Homes Inc
Purchase Details
Closed on
Sep 10, 2003
Bought by
Pwl Co Inc
Create a Home Valuation Report for This Property
The Home Valuation Report is an in-depth analysis detailing your home's value as well as a comparison with similar homes in the area
Home Values in the Area
Average Home Value in this Area
Purchase History
| Date | Buyer | Sale Price | Title Company |
|---|---|---|---|
| Watkins Nikki | $83,500 | -- | |
| Hare Aaron J | $76,000 | -- | |
| Aurora Loan Services Llc | $102,964 | -- | |
| Aurora Loan Services Llc | -- | -- | |
| Rural American Homes Inc | $36,000 | -- | |
| Pwl Co Inc | -- | -- |
Source: Public Records
Mortgage History
| Date | Status | Borrower | Loan Amount |
|---|---|---|---|
| Open | Watkins Nikki | $87,653 | |
| Previous Owner | Hare Aaron J | $74,623 |
Source: Public Records
Tax History Compared to Growth
Tax History
| Year | Tax Paid | Tax Assessment Tax Assessment Total Assessment is a certain percentage of the fair market value that is determined by local assessors to be the total taxable value of land and additions on the property. | Land | Improvement |
|---|---|---|---|---|
| 2024 | $2,234 | $86,594 | $21,600 | $64,994 |
| 2023 | $2,240 | $86,994 | $21,600 | $65,394 |
| 2022 | $1,679 | $55,055 | $16,000 | $39,055 |
| 2021 | $1,768 | $55,055 | $16,000 | $39,055 |
| 2020 | $1,770 | $55,055 | $16,000 | $39,055 |
| 2019 | $1,800 | $55,055 | $16,000 | $39,055 |
| 2018 | $1,616 | $49,655 | $10,600 | $39,055 |
| 2017 | $1,079 | $37,057 | $10,600 | $26,457 |
| 2016 | $1,154 | $34,951 | $10,600 | $24,351 |
| 2015 | $1,167 | $35,214 | $10,600 | $24,614 |
| 2014 | $1,114 | $32,326 | $7,448 | $24,878 |
| 2013 | -- | $31,101 | $7,448 | $23,653 |
Source: Public Records
Map
Nearby Homes
- 1212 Highway 211 NE
- 1226 Highway 211 NE
- 1206 Corkybrooke Ln
- 330 Anchors Way
- 917 Justin Dr Unit 3
- 388 Kay Dr Unit 1
- 1553 Shoal Creek Dr
- 1556 Shoal Creek Dr
- 130 (Tract 1) Bowman Mill Rd NE
- 212 Rainbow Ln
- 385 Finch Landing Rd
- 130 Bowman Mill Rd NE Unit 1
- 1431 Solomon Dr
- 1023 Solomon Ct
- 1453 Solomon Dr
- 508 Pleasant Hill Church Rd NE
- 315 Paige Way
- 867 Windward Rd
- 1593 Highway 82
- 1415 Red Oak Way
- 1245 Clearwater Dr Unit Lot 28
- 1245 Clearwater Dr
- 1243 Clearwater Dr Unit Lot 27
- 1243 Clearwater Dr
- 1243 Clearwater Dr Unit 1
- 1247 Clearwater Dr Unit Lot 29
- 1247 Clearwater Dr
- 1241 Clearwater Dr Unit Lot 26
- 1241 Clearwater Dr
- 1246 Clearwater Dr Unit Lot 37
- 1246 Clearwater Dr
- 1248 Clearwater Dr Unit Lot 36
- 1248 Clearwater Dr
- 1251 Clearwater Dr Unit Lot 30
- 1251 Clearwater Dr
- 1239 Clearwater Dr
- 1250 Clearwater Dr Unit Lot 35
- 1250 Clearwater Dr
- 433 Ross Rd
- 1237 Clearwater Dr