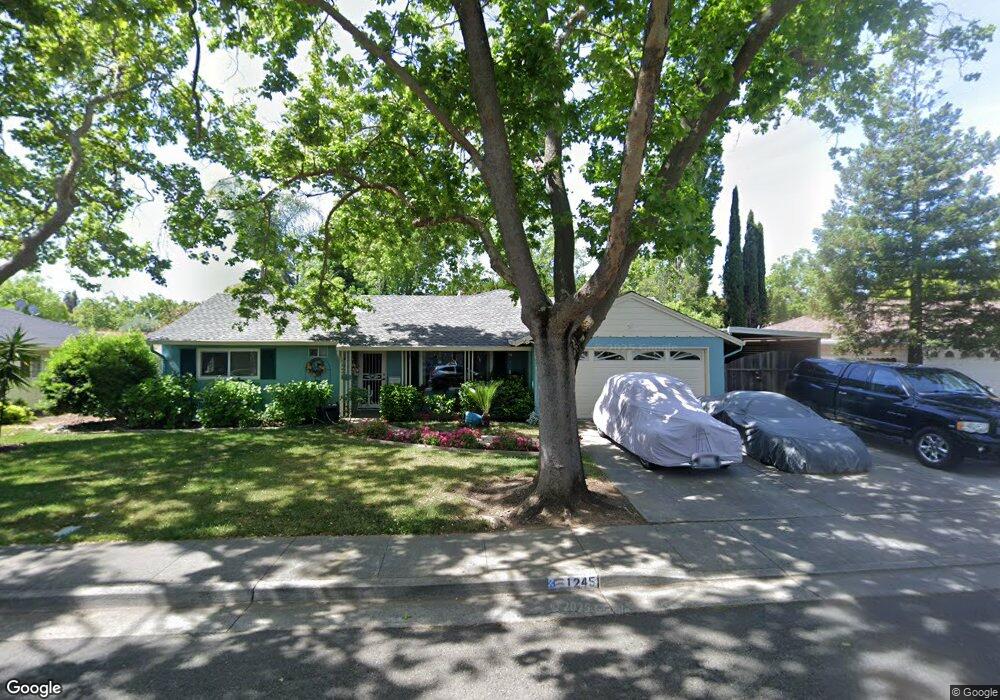
1245 Grant St Fairfield, CA 94533
Estimated Value: $465,391 - $511,000
3
Beds
2
Baths
1,614
Sq Ft
$303/Sq Ft
Est. Value
About This Home
This home is located at 1245 Grant St, Fairfield, CA 94533 and is currently estimated at $489,098, approximately $303 per square foot. 1245 Grant St is a home located in Solano County with nearby schools including Fairview Elementary School, Crystal Middle School, and Armijo High School.
Ownership History
Date
Name
Owned For
Owner Type
Purchase Details
Closed on
Sep 6, 2000
Sold by
Nolan Richard L
Bought by
Nolan Richard L and Nolan Nancy Jo
Current Estimated Value
Create a Home Valuation Report for This Property
The Home Valuation Report is an in-depth analysis detailing your home's value as well as a comparison with similar homes in the area
Home Values in the Area
Average Home Value in this Area
Purchase History
| Date | Buyer | Sale Price | Title Company |
|---|---|---|---|
| Nolan Richard L | -- | -- |
Source: Public Records
Tax History
| Year | Tax Paid | Tax Assessment Tax Assessment Total Assessment is a certain percentage of the fair market value that is determined by local assessors to be the total taxable value of land and additions on the property. | Land | Improvement |
|---|---|---|---|---|
| 2025 | $810 | $77,172 | $14,931 | $62,241 |
| 2024 | $810 | $75,660 | $14,639 | $61,021 |
| 2023 | $784 | $74,177 | $14,352 | $59,825 |
| 2022 | $773 | $72,723 | $14,072 | $58,651 |
| 2021 | $764 | $71,298 | $13,797 | $57,501 |
| 2020 | $746 | $70,568 | $13,656 | $56,912 |
| 2019 | $727 | $69,186 | $13,389 | $55,797 |
| 2018 | $748 | $67,830 | $13,127 | $54,703 |
| 2017 | $713 | $66,501 | $12,870 | $53,631 |
| 2016 | $697 | $65,198 | $12,618 | $52,580 |
| 2015 | $650 | $64,220 | $12,429 | $51,791 |
| 2014 | $643 | $62,963 | $12,186 | $50,777 |
Source: Public Records
Map
Nearby Homes
- 1024 Tyler St
- 736 Nevada St
- 1500 Harrison St
- 1042 Hayes St
- 1217 Dana Dr
- 1316 Empire St
- 0 Webster St Unit 41120649
- 1443 Minnesota St
- 1661 Fairfield Ave
- 1417 Hawaii St
- 1625 Minnesota St
- 901 Johnson St
- 0 Madison St
- 1654 Minnesota St
- 1745 Utah St
- 318 Taylor St
- 751 Hillcrest Ct
- 2034 Cambridge Dr
- 1837 Vermont St
- 225 Pennsylvania Ave Unit E7
- 1241 Grant St Unit B
- 1241 Grant St
- 1222 Pennsylvania Ave
- 1249 Grant St
- 1218 Pennsylvania Ave
- 1248 Grant St
- 1233 Grant Ct
- 1244 Grant St
- 1237 Grant Ct
- 1252 Grant St
- 1240 Grant St
- 1214 Pennsylvania Ave
- 1302 Pennsylvania Ave
- 1313 Lincoln St
- 1229 Grant Ct
- 1236 Grant St
- 1309 Lincoln St
- 1317 Lincoln St
- 1210 Pennsylvania Ave
- 1305 Lincoln St
Your Personal Tour Guide
Ask me questions while you tour the home.