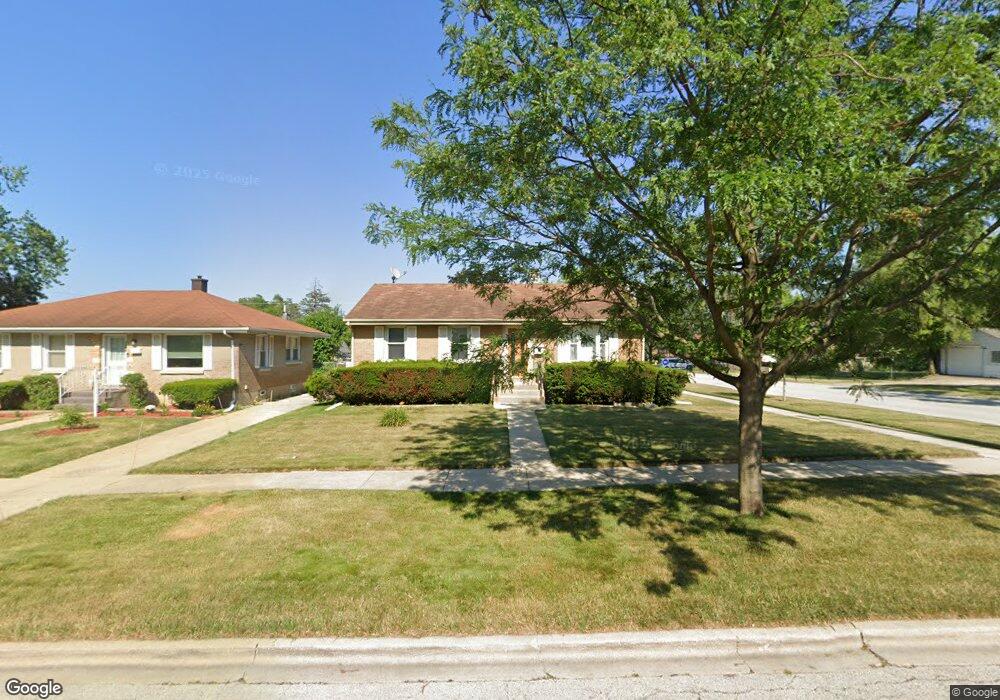
1245 N Irving Ave Berkeley, IL 60163
Estimated Value: $256,510 - $287,000
3
Beds
2
Baths
913
Sq Ft
$298/Sq Ft
Est. Value
About This Home
This home is located at 1245 N Irving Ave, Berkeley, IL 60163 and is currently estimated at $272,378, approximately $298 per square foot. 1245 N Irving Ave is a home located in Cook County with nearby schools including Macarthur Intermediate School, Sunnyside Elementary School, and Proviso West High School.
Ownership History
Date
Name
Owned For
Owner Type
Purchase Details
Closed on
Dec 20, 2007
Sold by
Deutsche Bank National Trust Co
Bought by
Allen Adolphus
Current Estimated Value
Purchase Details
Closed on
Sep 12, 2007
Sold by
Huff Clarence E
Bought by
Deutsche Bank National Trust Co and Carrington Mortgage Loan Trust Series 20
Purchase Details
Closed on
Jun 28, 2004
Sold by
Fuller Tracy L and Fuller Sherell G
Bought by
Huff Clarence E and Huff Phyllis L
Home Financials for this Owner
Home Financials are based on the most recent Mortgage that was taken out on this home.
Original Mortgage
$168,000
Interest Rate
5.9%
Mortgage Type
Unknown
Purchase Details
Closed on
Apr 30, 1997
Sold by
Klasen Daniel J and Klasen Mary L
Bought by
Fuller Tracy L and Fuller Sherell G
Home Financials for this Owner
Home Financials are based on the most recent Mortgage that was taken out on this home.
Original Mortgage
$123,978
Interest Rate
8.13%
Mortgage Type
FHA
Create a Home Valuation Report for This Property
The Home Valuation Report is an in-depth analysis detailing your home's value as well as a comparison with similar homes in the area
Home Values in the Area
Average Home Value in this Area
Purchase History
| Date | Buyer | Sale Price | Title Company |
|---|---|---|---|
| Allen Adolphus | $190,000 | None Available | |
| Deutsche Bank National Trust Co | -- | None Available | |
| Huff Clarence E | $210,000 | Git | |
| Huff Clarence E | $210,000 | Git | |
| Fuller Tracy L | $127,000 | -- |
Source: Public Records
Mortgage History
| Date | Status | Borrower | Loan Amount |
|---|---|---|---|
| Previous Owner | Huff Clarence E | $168,000 | |
| Previous Owner | Fuller Tracy L | $123,978 | |
| Closed | Huff Clarence E | $42,000 |
Source: Public Records
Tax History
| Year | Tax Paid | Tax Assessment Tax Assessment Total Assessment is a certain percentage of the fair market value that is determined by local assessors to be the total taxable value of land and additions on the property. | Land | Improvement |
|---|---|---|---|---|
| 2025 | $1,857 | $24,000 | $4,086 | $19,914 |
| 2024 | $1,857 | $24,000 | $4,086 | $19,914 |
| 2023 | $2,271 | $24,000 | $4,086 | $19,914 |
| 2022 | $2,271 | $18,330 | $2,786 | $15,544 |
| 2021 | $2,205 | $18,329 | $2,785 | $15,544 |
| 2020 | $1,937 | $18,329 | $2,785 | $15,544 |
| 2019 | $2,197 | $14,083 | $2,600 | $11,483 |
| 2018 | $2,158 | $14,083 | $2,600 | $11,483 |
| 2017 | $2,027 | $14,083 | $2,600 | $11,483 |
| 2016 | $3,049 | $12,410 | $2,414 | $9,996 |
| 2015 | $3,194 | $12,410 | $2,414 | $9,996 |
| 2014 | $3,173 | $12,410 | $2,414 | $9,996 |
| 2013 | $3,522 | $14,127 | $2,414 | $11,713 |
Source: Public Records
Map
Nearby Homes
- 5700 Saint Charles Rd
- 5706 Saint Charles Rd
- 1447 N Ashbel Ave
- 1428 1/2 N Ashbel Ave
- 1529 N Hillside Ave
- 5905 Superior St
- 4904 W Hawthorne Ave
- 4938 W Randolph St
- 768 N Rohde Ave
- 1463 Speechley Blvd
- 605 N Wolf Rd Unit B9
- 51 50th Ave
- 504 N Irving Ave
- 520 N Wolf Rd Unit 203
- 33 49th Ave
- 129 49th Ave
- 5949 School St
- 515 S Parkview Ave
- 47 48th Ave
- 241 48th Ave
- 1241 N Irving Ave
- 1237 N Irving Ave
- 1301 N Irving Ave
- 1244 N Hillside Ave
- 1240 N Hillside Ave
- 1233 N Irving Ave
- 1236 N Hillside Ave
- 1305 N Irving Ave
- 1300 N Hillside Ave
- 1244 N Irving Ave
- 1229 N Irving Ave
- 1232 N Hillside Ave
- 1240 N Irving Ave
- 1304 N Hillside Ave
- 1236 N Irving Ave
- 1309 N Irving Ave
- 1300 N Irving Ave
- 1225 N Irving Ave
- 1232 N Irving Ave
- 1308 N Hillside Ave
Your Personal Tour Guide
Ask me questions while you tour the home.