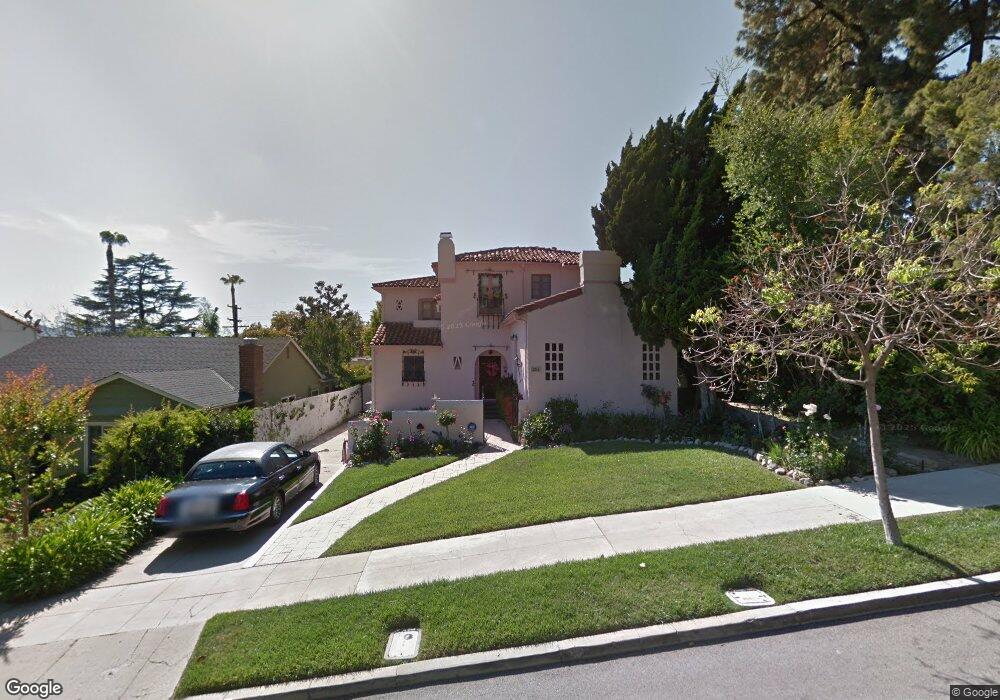
1245 N Isabel St Glendale, CA 91207
Rossmoyne NeighborhoodEstimated Value: $1,713,241 - $1,833,000
3
Beds
2
Baths
2,442
Sq Ft
$728/Sq Ft
Est. Value
About This Home
This home is located at 1245 N Isabel St, Glendale, CA 91207 and is currently estimated at $1,776,810, approximately $727 per square foot. 1245 N Isabel St is a home located in Los Angeles County with nearby schools including R.D. White Elementary School, Woodrow Wilson Middle School, and Glendale High School.
Ownership History
Date
Name
Owned For
Owner Type
Purchase Details
Closed on
Aug 26, 2003
Sold by
Roat Richard
Bought by
Roat Richard and Roat Kathy Arntzen
Current Estimated Value
Purchase Details
Closed on
Aug 5, 1998
Sold by
Roat Richard And Kathy Trs Roat Trust
Bought by
Roat Richard and Roat Kathy Arntzen
Home Financials for this Owner
Home Financials are based on the most recent Mortgage that was taken out on this home.
Original Mortgage
$207,000
Interest Rate
6.5%
Purchase Details
Closed on
Dec 6, 1994
Sold by
Roat Richard
Bought by
Roat Richard and Roat Kathy Arntzen
Create a Home Valuation Report for This Property
The Home Valuation Report is an in-depth analysis detailing your home's value as well as a comparison with similar homes in the area
Home Values in the Area
Average Home Value in this Area
Purchase History
| Date | Buyer | Sale Price | Title Company |
|---|---|---|---|
| Roat Richard | -- | Southland Title Company | |
| Roat Richard | -- | Fidelity Title | |
| Roat Richard | -- | -- | |
| Roat Richard | -- | -- |
Source: Public Records
Mortgage History
| Date | Status | Borrower | Loan Amount |
|---|---|---|---|
| Previous Owner | Roat Richard | $207,000 |
Source: Public Records
Tax History
| Year | Tax Paid | Tax Assessment Tax Assessment Total Assessment is a certain percentage of the fair market value that is determined by local assessors to be the total taxable value of land and additions on the property. | Land | Improvement |
|---|---|---|---|---|
| 2025 | $5,299 | $477,866 | $191,225 | $286,641 |
| 2024 | $5,299 | $468,497 | $187,476 | $281,021 |
| 2023 | $5,181 | $459,311 | $183,800 | $275,511 |
| 2022 | $5,088 | $450,306 | $180,197 | $270,109 |
| 2021 | $4,990 | $441,477 | $176,664 | $264,813 |
| 2019 | $4,800 | $428,384 | $171,425 | $256,959 |
| 2018 | $4,688 | $419,985 | $168,064 | $251,921 |
| 2016 | $4,452 | $403,679 | $161,539 | $242,140 |
| 2015 | $4,362 | $397,616 | $159,113 | $238,503 |
| 2014 | $4,328 | $389,829 | $155,997 | $233,832 |
Source: Public Records
Map
Nearby Homes
- 1238 N Isabel St
- 1239 Geneva St
- 404 E Randolph St
- 1248 N Everett St
- 1130 Campbell St Unit 106
- 1152 N Cedar St
- 111 W Mountain St Unit 2
- 1126 N Central Ave Unit 105
- 1126 N Central Ave Unit 101
- 1801 Greenbriar Rd
- 1201 Viola Ave Unit 104
- 719 N Jackson St
- 728 Cordova Ave
- 1321 Greenbriar Rd
- 222 Monterey Rd Unit 104
- 222 Monterey Rd Unit 1205
- 222 Monterey Rd Unit 206
- 222 Monterey Rd Unit 1302
- 222 Monterey Rd Unit 1603
- 1400 Valley View Rd Unit 1
- 1241 N Isabel St
- 534 E Mountain St
- 1237 N Isabel St
- 1250 N Jackson St
- 1246 N Jackson St
- 1254 N Jackson St
- 1233 N Isabel St
- 1242 N Jackson St
- 1260 N Jackson St
- 1242 N Isabel St
- 1246 N Isabel St Unit A
- 1246 N Isabel St
- 1229 N Isabel St
- 533 E Mountain St
- 1238 N Jackson St
- 529 E Mountain St
- 539 E Mountain St
- 1234 N Isabel St
- 1234 N Jackson St
- 1225 N Isabel St
Your Personal Tour Guide
Ask me questions while you tour the home.