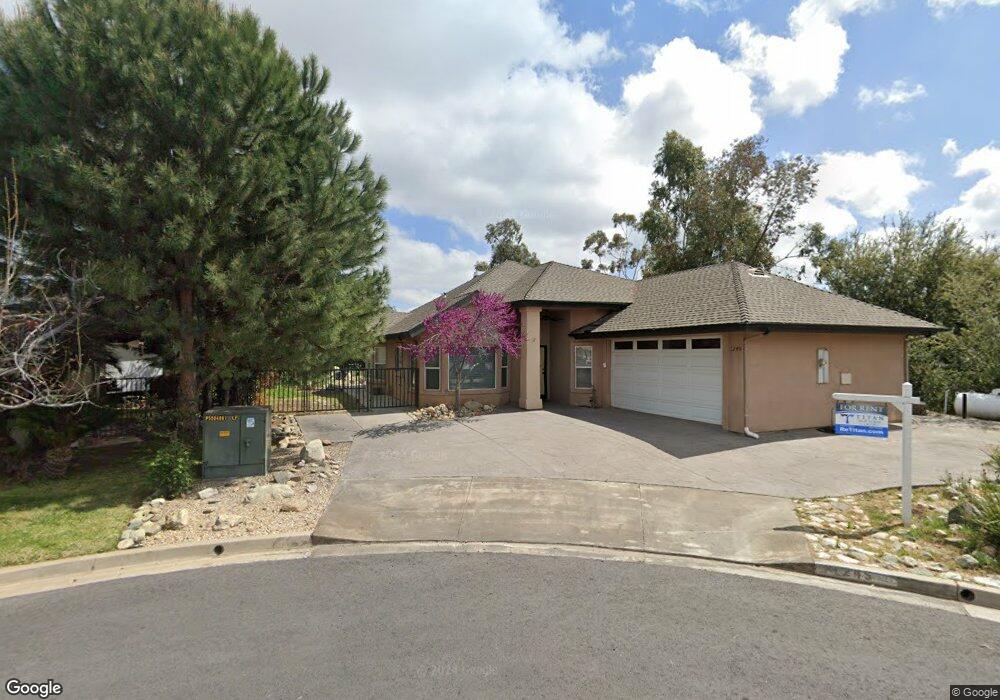
1245 Ruby Ct Calimesa, CA 92320
Estimated Value: $543,211 - $589,000
3
Beds
2
Baths
1,691
Sq Ft
$335/Sq Ft
Est. Value
About This Home
This home is located at 1245 Ruby Ct, Calimesa, CA 92320 and is currently estimated at $566,303, approximately $334 per square foot. 1245 Ruby Ct is a home located in Riverside County with nearby schools including Calimesa Elementary, Mesa View Middle School, and Yucaipa High School.
Ownership History
Date
Name
Owned For
Owner Type
Purchase Details
Closed on
Sep 4, 2013
Sold by
Jergensen Dean and Jergensen Leanor
Bought by
Jergensen Todd and Jergensen Shirley
Current Estimated Value
Purchase Details
Closed on
Oct 29, 1997
Sold by
Jergensen Todd Dean and Jergensen Shirley
Bought by
Jergensen Dean Roger and Jergensen Leanor D S
Purchase Details
Closed on
Jun 26, 1997
Sold by
Rbc Americorp Inc
Bought by
Jergensen Todd Dean and Jergensen Shirley
Purchase Details
Closed on
Mar 13, 1996
Sold by
Enterprise Holdings Inc
Bought by
Rbc Americorp Inc
Create a Home Valuation Report for This Property
The Home Valuation Report is an in-depth analysis detailing your home's value as well as a comparison with similar homes in the area
Home Values in the Area
Average Home Value in this Area
Purchase History
| Date | Buyer | Sale Price | Title Company |
|---|---|---|---|
| Jergensen Todd | -- | None Available | |
| Jergensen Dean Roger | $100,000 | Lawyers Title Company | |
| Jergensen Todd Dean | $57,000 | Commonwealth Land Title Co | |
| Rbc Americorp Inc | $127,413 | American Title Ins Co |
Source: Public Records
Tax History
| Year | Tax Paid | Tax Assessment Tax Assessment Total Assessment is a certain percentage of the fair market value that is determined by local assessors to be the total taxable value of land and additions on the property. | Land | Improvement |
|---|---|---|---|---|
| 2025 | $3,621 | $302,571 | $96,549 | $206,022 |
| 2023 | $3,621 | $290,823 | $92,800 | $198,023 |
| 2022 | $3,759 | $285,122 | $90,981 | $194,141 |
| 2021 | $3,714 | $279,533 | $89,198 | $190,335 |
| 2020 | $3,711 | $276,668 | $88,284 | $188,384 |
| 2019 | $3,564 | $271,244 | $86,553 | $184,691 |
| 2018 | $3,533 | $265,926 | $84,858 | $181,068 |
| 2017 | $3,461 | $260,713 | $83,195 | $177,518 |
| 2016 | $3,399 | $255,602 | $81,564 | $174,038 |
| 2015 | $3,365 | $251,765 | $80,340 | $171,425 |
| 2014 | $3,302 | $246,835 | $78,767 | $168,068 |
Source: Public Records
Map
Nearby Homes
- 285 Harruby Dr
- 0 Slack Place
- 199 Summit View Dr Unit B
- 366 Smokeridge Trail
- 384 Sandalwood Dr
- 66 Country Club Dr
- 366 Flordason Dr
- 323 Rogers Ln
- 1148 Cherry Ln
- 371 Rogers Ct
- 1002 California St
- 35113 Mesa Grande Dr
- 181 Fisher Ct
- 1265 Heritage Dr
- 950 California St Unit 40
- 950 California St Unit 82
- 950 California St Unit 49
- 950 California St Unit 60
- 35080 Chandler Ave Unit 39
- 35080 Chandler Ave Unit 11
- 1241 Ruby Ct
- 1248 Ruby Ct
- 1180 Fairway Ln
- 1240 Ruby Ct
- 1235 Ruby Ct
- 1176 Fairway Ln
- 1186 Fairway Ln
- 281 Slack Place
- 263 Slack Place
- 1244 Ruby Ct
- 1170 Fairway Ln
- 303 Slack Place
- 287 Slack Place
- 259 Slack Place
- 1190 Fairway Ln
- 266 Slack Place
- 291 Slack Place
- 270 Slack Place
- 1166 Fairway Ln
- 260 Slack Place
Your Personal Tour Guide
Ask me questions while you tour the home.