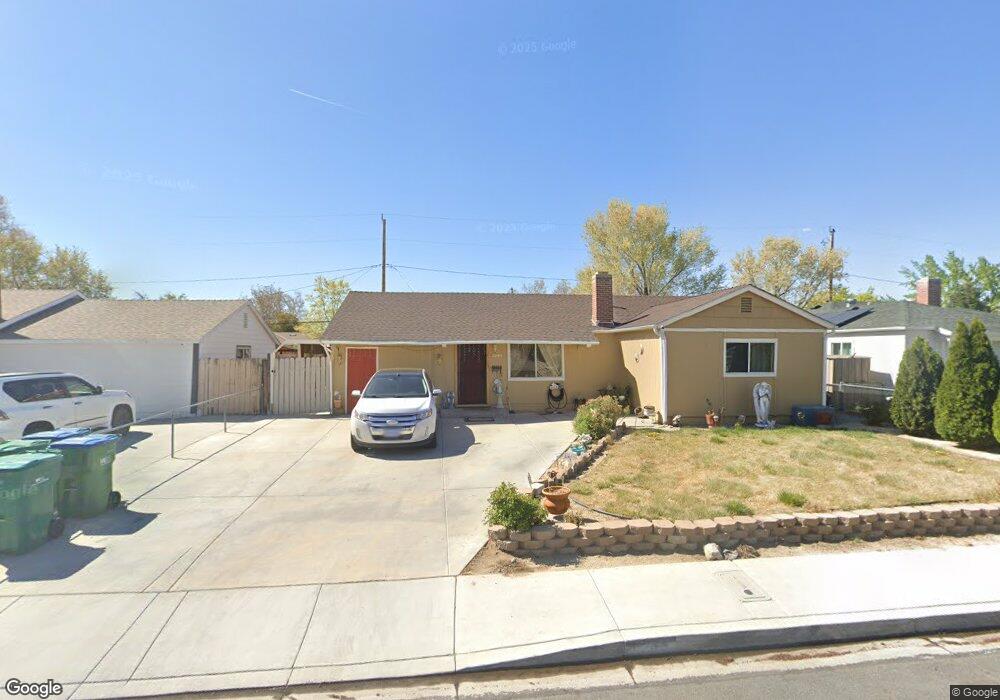
1245 Russell Way Sparks, NV 89431
North Rock NeighborhoodEstimated Value: $392,000 - $417,000
4
Beds
2
Baths
1,537
Sq Ft
$264/Sq Ft
Est. Value
About This Home
This home is located at 1245 Russell Way, Sparks, NV 89431 and is currently estimated at $406,536, approximately $264 per square foot. 1245 Russell Way is a home located in Washoe County with nearby schools including Alice Maxwell Elementary School, Sparks Middle School, and Sparks High School.
Ownership History
Date
Name
Owned For
Owner Type
Purchase Details
Closed on
Jan 13, 2009
Sold by
Jpmorgan Chase Bank Na
Bought by
Muniz Josefina
Current Estimated Value
Home Financials for this Owner
Home Financials are based on the most recent Mortgage that was taken out on this home.
Original Mortgage
$119,130
Outstanding Balance
$74,614
Interest Rate
5.01%
Mortgage Type
FHA
Estimated Equity
$331,922
Purchase Details
Closed on
Aug 14, 2008
Sold by
Garcia Hernandez Victor
Bought by
Washington Mutual Bank
Purchase Details
Closed on
Jan 11, 2007
Sold by
Gray William C and Gray Delores Ann
Bought by
Garcia Hernandez Victor
Home Financials for this Owner
Home Financials are based on the most recent Mortgage that was taken out on this home.
Original Mortgage
$188,000
Interest Rate
6.62%
Mortgage Type
Unknown
Create a Home Valuation Report for This Property
The Home Valuation Report is an in-depth analysis detailing your home's value as well as a comparison with similar homes in the area
Home Values in the Area
Average Home Value in this Area
Purchase History
| Date | Buyer | Sale Price | Title Company |
|---|---|---|---|
| Muniz Josefina | $120,000 | Ticor Title - Reno | |
| Jpmorgan Chase Bank National Association | $120,000 | Ticor Title Reno | |
| Washington Mutual Bank | $113,000 | Ticor Title Of Nevada Inc | |
| Garcia Hernandez Victor | $235,000 | Western Title Incorporated |
Source: Public Records
Mortgage History
| Date | Status | Borrower | Loan Amount |
|---|---|---|---|
| Open | Muniz Josefina | $119,130 | |
| Previous Owner | Garcia Hernandez Victor | $188,000 |
Source: Public Records
Tax History Compared to Growth
Tax History
| Year | Tax Paid | Tax Assessment Tax Assessment Total Assessment is a certain percentage of the fair market value that is determined by local assessors to be the total taxable value of land and additions on the property. | Land | Improvement |
|---|---|---|---|---|
| 2025 | $756 | $50,923 | $31,325 | $19,598 |
| 2024 | $756 | $49,482 | $30,100 | $19,382 |
| 2023 | $735 | $47,756 | $29,890 | $17,866 |
| 2022 | $715 | $39,586 | $25,095 | $14,491 |
| 2021 | $695 | $30,865 | $16,765 | $14,100 |
| 2020 | $673 | $30,298 | $16,345 | $13,953 |
| 2019 | $654 | $29,084 | $15,890 | $13,194 |
| 2018 | $630 | $23,885 | $11,235 | $12,650 |
| 2017 | $614 | $22,699 | $10,150 | $12,549 |
| 2016 | $600 | $20,773 | $8,225 | $12,548 |
| 2015 | $597 | $19,457 | $7,140 | $12,317 |
| 2014 | $581 | $18,030 | $6,440 | $11,590 |
| 2013 | -- | $15,214 | $3,955 | $11,259 |
Source: Public Records
Map
Nearby Homes
- 1124 Sbragia Way
- 1121 Greenbrae Dr
- 1365 Prospect Ave
- 1003 Sbragia Way
- 1705 9th St
- 1110 Xman Way
- 2154 Oppio St
- 1655 Byrd Dr
- 1160 York Way
- 1780 Greenbrae Dr
- 1595 York Way
- 1527 Steven Ct
- 1560 Steven Ct Unit 2
- 1010 12th St
- 1536 Irene Way
- 1345 Plymouth Way
- 985 10th St
- 973 Damon Ln
- 1125 Dodson Way
- 1799 Vance Way
- 1265 Russell Way
- 1225 Russell Way
- 1240 Greenbrae Dr
- 1220 Greenbrae Dr
- 1260 Greenbrae Dr
- 1285 Russell Way
- 1125 Russell Way
- 1280 Greenbrae Dr
- 1240 Russell Way
- 1206 Greenbrae Dr
- 1220 Russell Way
- 1260 Russell Way
- 1305 Russell Way
- 1121 Russell Way
- 1280 Russell Way
- 1300 Greenbrae Dr
- 1124 Russell Way
- 1122 Greenbrae Dr
- 1325 Russell Way
- 1300 Russell Way