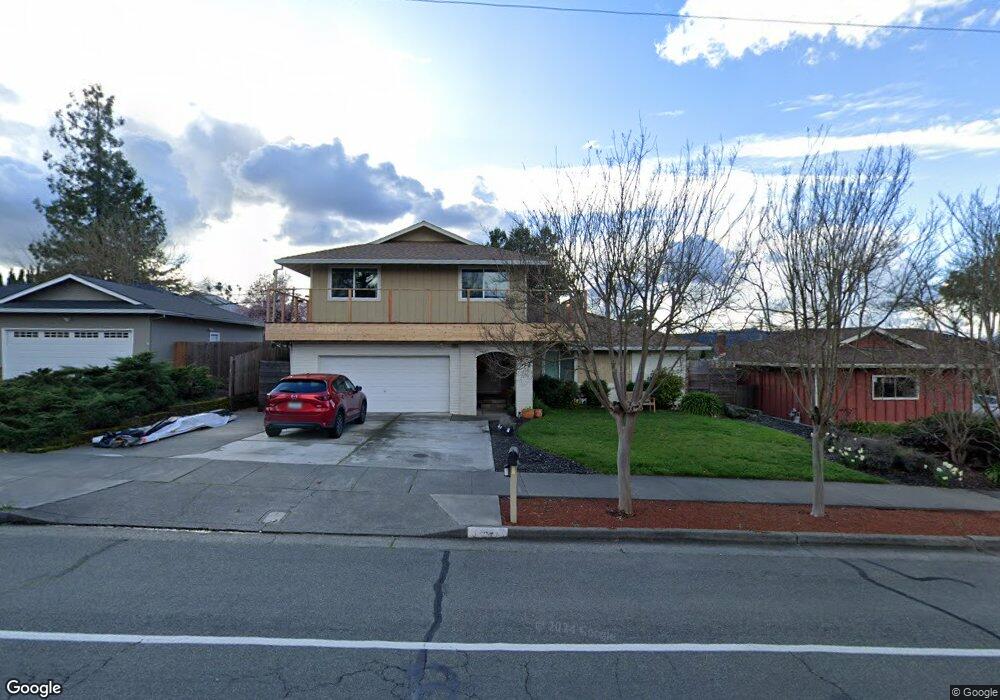
1245 Saint Francis Rd Santa Rosa, CA 95409
Skyhawk NeighborhoodEstimated Value: $990,453 - $1,088,000
5
Beds
3
Baths
2,795
Sq Ft
$371/Sq Ft
Est. Value
About This Home
This home is located at 1245 Saint Francis Rd, Santa Rosa, CA 95409 and is currently estimated at $1,036,113, approximately $370 per square foot. 1245 Saint Francis Rd is a home located in Sonoma County with nearby schools including Sequoia Elementary School, Rincon Valley Middle School, and Maria Carrillo High School.
Ownership History
Date
Name
Owned For
Owner Type
Purchase Details
Closed on
Jul 12, 2023
Sold by
Spears David R and Spears Beverly H
Bought by
David R Spears And Beverly H Spears Trust and Spears
Current Estimated Value
Purchase Details
Closed on
Nov 13, 2014
Sold by
The Jim & Glennda Roatch Family Trust
Bought by
Spears David R and Spears Beverly H
Home Financials for this Owner
Home Financials are based on the most recent Mortgage that was taken out on this home.
Original Mortgage
$489,500
Interest Rate
3.92%
Mortgage Type
New Conventional
Purchase Details
Closed on
Sep 13, 2000
Sold by
Terry Jason Edward
Bought by
Roatch Terry Tamara D
Purchase Details
Closed on
Dec 5, 1996
Sold by
Roatch James N and Roatch Glennda L
Bought by
Roatch James N and Roatch Glennda L
Create a Home Valuation Report for This Property
The Home Valuation Report is an in-depth analysis detailing your home's value as well as a comparison with similar homes in the area
Home Values in the Area
Average Home Value in this Area
Purchase History
| Date | Buyer | Sale Price | Title Company |
|---|---|---|---|
| David R Spears And Beverly H Spears Trust | -- | None Listed On Document | |
| Spears David R | $612,000 | Cornerstone Title Company | |
| Roatch Terry Tamara D | -- | North Bay Title Co | |
| Roatch James N | -- | -- |
Source: Public Records
Mortgage History
| Date | Status | Borrower | Loan Amount |
|---|---|---|---|
| Previous Owner | Spears David R | $489,500 |
Source: Public Records
Tax History Compared to Growth
Tax History
| Year | Tax Paid | Tax Assessment Tax Assessment Total Assessment is a certain percentage of the fair market value that is determined by local assessors to be the total taxable value of land and additions on the property. | Land | Improvement |
|---|---|---|---|---|
| 2025 | $8,449 | $735,520 | $294,449 | $441,071 |
| 2024 | $8,449 | $721,099 | $288,676 | $432,423 |
| 2023 | $8,449 | $706,961 | $283,016 | $423,945 |
| 2022 | $7,800 | $693,100 | $277,467 | $415,633 |
| 2021 | $7,644 | $679,511 | $272,027 | $407,484 |
| 2020 | $7,616 | $672,544 | $269,238 | $403,306 |
| 2019 | $7,546 | $659,358 | $263,959 | $395,399 |
| 2018 | $7,501 | $646,431 | $258,784 | $387,647 |
| 2017 | $7,364 | $633,757 | $253,710 | $380,047 |
| 2016 | $7,291 | $621,332 | $248,736 | $372,596 |
| 2015 | $7,073 | $612,000 | $245,000 | $367,000 |
| 2014 | $3,139 | $266,840 | $63,701 | $203,139 |
Source: Public Records
Map
Nearby Homes
- 5534 Rainbow Cir
- 5682 Raters Dr
- 184 El Encanto Way
- 5518 Marit Dr
- 5741 Evening Way
- 5388 Sonoma Hwy
- 5794 Owl Hill Ave
- 5644 Eastlake Dr
- 5056 Fravel Ln
- 5088 Firestone Ct
- 5426 Spring Lake Ct
- 305 Simone Place N
- 5969 Vista Ridge
- 5086 Charmian Dr
- 5985 Vista Ridge
- 5980 Vista Ridge
- 537 Emerald Park Ct
- 5209 San Luis Ave
- 206 Indian Creek Dr
- 5201 San Luis Ave
- 1249 Saint Francis Rd
- 1241 Saint Francis Rd
- 5516 Rainbow Cir
- 5518 Rainbow Cir
- 1253 Saint Francis Rd
- 1237 Saint Francis Rd
- 5514 Rainbow Cir
- 5520 Rainbow Cir
- 1248 Saint Francis Rd
- 1254 Saint Francis Rd
- 5522 Rainbow Cir
- 1257 Saint Francis Rd
- 1233 Saint Francis Rd
- 5512 Rainbow Cir
- 5519 Rainbow Cir
- 5524 Rainbow Cir
- 5701 Reynaud Ct
- 5530 El Encanto Cir
- 5510 Rainbow Cir
- 5710 Reynaud Ct