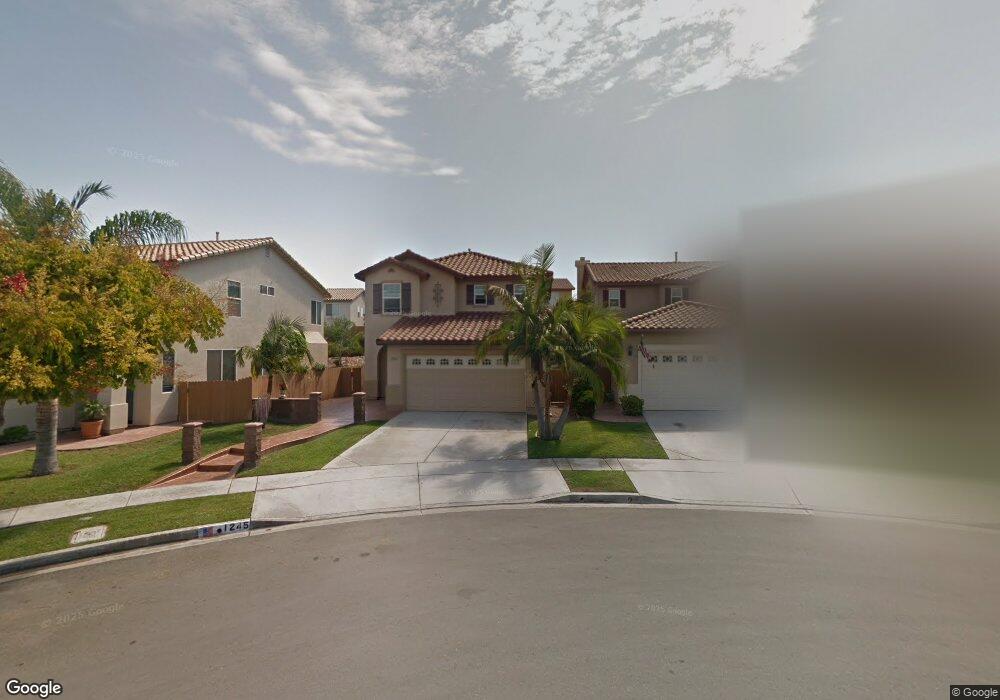
1245 Sand Drift Point Unit 7A San Diego, CA 92154
Ocean View Hills NeighborhoodEstimated Value: $729,000 - $929,000
3
Beds
3
Baths
1,653
Sq Ft
$505/Sq Ft
Est. Value
About This Home
This home is located at 1245 Sand Drift Point Unit 7A, San Diego, CA 92154 and is currently estimated at $834,669, approximately $504 per square foot. 1245 Sand Drift Point Unit 7A is a home located in San Diego County with nearby schools including Ocean View Hills, Vista Del Mar, and San Ysidro Middle School.
Ownership History
Date
Name
Owned For
Owner Type
Purchase Details
Closed on
Jul 15, 2024
Sold by
Gutierrez Rene Rios and Cruz Vanessa
Bought by
Cruz Gutierrez Trust and Gutierrez
Current Estimated Value
Purchase Details
Closed on
Mar 14, 2002
Sold by
Pardee Homes
Bought by
Gutierrez Rene R and Cruz Vanessa
Home Financials for this Owner
Home Financials are based on the most recent Mortgage that was taken out on this home.
Original Mortgage
$249,755
Interest Rate
7.08%
Create a Home Valuation Report for This Property
The Home Valuation Report is an in-depth analysis detailing your home's value as well as a comparison with similar homes in the area
Home Values in the Area
Average Home Value in this Area
Purchase History
| Date | Buyer | Sale Price | Title Company |
|---|---|---|---|
| Cruz Gutierrez Trust | -- | None Listed On Document | |
| Gutierrez Rene R | $263,000 | First American Title |
Source: Public Records
Mortgage History
| Date | Status | Borrower | Loan Amount |
|---|---|---|---|
| Previous Owner | Gutierrez Rene R | $249,755 |
Source: Public Records
Tax History Compared to Growth
Tax History
| Year | Tax Paid | Tax Assessment Tax Assessment Total Assessment is a certain percentage of the fair market value that is determined by local assessors to be the total taxable value of land and additions on the property. | Land | Improvement |
|---|---|---|---|---|
| 2025 | $6,031 | $388,355 | $140,329 | $248,026 |
| 2024 | $6,031 | $380,741 | $137,578 | $243,163 |
| 2023 | $5,908 | $373,277 | $134,881 | $238,396 |
| 2022 | $5,674 | $365,959 | $132,237 | $233,722 |
| 2021 | $5,675 | $358,785 | $129,645 | $229,140 |
| 2020 | $5,578 | $355,107 | $128,316 | $226,791 |
| 2019 | $5,347 | $348,145 | $125,800 | $222,345 |
| 2018 | $5,253 | $341,320 | $123,334 | $217,986 |
| 2017 | $81 | $334,628 | $120,916 | $213,712 |
| 2016 | $5,010 | $328,068 | $118,546 | $209,522 |
| 2015 | $4,964 | $323,141 | $116,766 | $206,375 |
| 2014 | $4,898 | $316,812 | $114,479 | $202,333 |
Source: Public Records
Map
Nearby Homes
- 1250 Sand Drift Point
- 1210 Jade Cove Ct
- 1270 Paseo Sea Breeze Unit 26
- 5211 Calle Rockfish Unit 90
- 1251 Paseo Sea Breeze Unit 14
- 1251 Paseo Sea Breeze Unit 17
- 1320 Calle Sandcliff Unit 41
- 5140 Calle Sand Arch Unit 61
- 5405 Calle Sand Arch Unit 197
- 5360 Calle Rockfish Unit 32
- 5402 Sand Arch Ln Unit 199
- 1233 Sandy Cape Ct
- 5317 Westport View Dr
- 5192 Emerald Cove
- 5208 Surfwalk Way Unit 153
- 5265 Beachfront Cove Unit 167
- 5261 Beachfront Cove Unit 175
- 5080 Sea Reef Place
- 5240 Beachfront Cove Unit 89
- 5280 Beachfront Cove Unit 239
- 1249 Sand Drift Point
- 1241 Sand Drift Point
- 1237 Sand Drift Point
- 1253 Sand Drift Point
- 1250 Jade Cove Ct Unit 7A
- 1246 Jade Cove Ct
- 1233 Sand Drift Point
- 1242 Jade Cove Ct
- 1254 Jade Cove Ct
- 1238 Jade Cove Ct Unit 7A
- 1229 Sand Drift Point
- 1234 Jade Cove Ct
- 1225 Sand Drift Point Unit 7A
- 1242 Sand Drift Point
- 1254 Sand Drift Point
- 1238 Sand Drift Point
- 1246 Sand Drift Point
- 1230 Jade Cove Ct
- 1234 Sand Drift Point Unit 7A
- 1223 Sand Drift Point