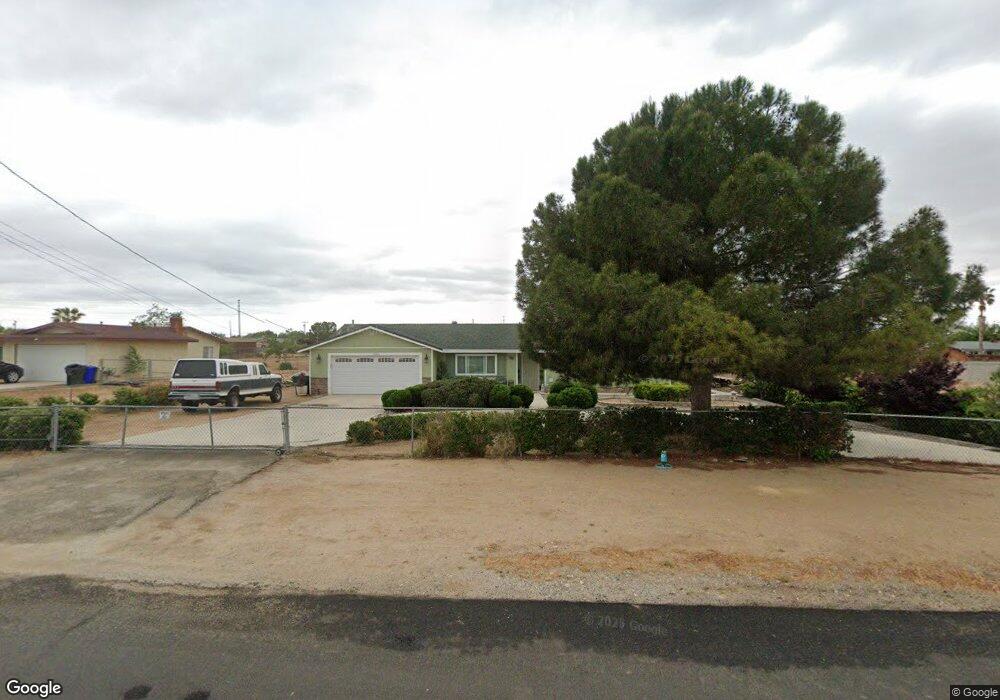
12450 Magnolia Ave Victorville, CA 92395
Estimated Value: $397,000 - $424,000
3
Beds
2
Baths
1,778
Sq Ft
$232/Sq Ft
Est. Value
About This Home
This home is located at 12450 Magnolia Ave, Victorville, CA 92395 and is currently estimated at $412,294, approximately $231 per square foot. 12450 Magnolia Ave is a home located in San Bernardino County with nearby schools including Mojave Vista Elementary School, Lomitas Elementary School, and Lakeview Leadership Academy.
Ownership History
Date
Name
Owned For
Owner Type
Purchase Details
Closed on
Mar 24, 2002
Sold by
Ervin Sondra L
Bought by
Liberatore Randall P and Ervin Sondra L
Current Estimated Value
Home Financials for this Owner
Home Financials are based on the most recent Mortgage that was taken out on this home.
Original Mortgage
$82,400
Interest Rate
6.84%
Purchase Details
Closed on
Feb 17, 2000
Sold by
Hud
Bought by
Ervin Sondra L
Home Financials for this Owner
Home Financials are based on the most recent Mortgage that was taken out on this home.
Original Mortgage
$67,600
Interest Rate
8.99%
Purchase Details
Closed on
Oct 11, 1999
Sold by
Gmac Mtg Corp
Bought by
Hud
Purchase Details
Closed on
Oct 8, 1999
Sold by
Doan Paul E and Doan Carol A
Bought by
Gmac Mtg Corp
Create a Home Valuation Report for This Property
The Home Valuation Report is an in-depth analysis detailing your home's value as well as a comparison with similar homes in the area
Home Values in the Area
Average Home Value in this Area
Purchase History
| Date | Buyer | Sale Price | Title Company |
|---|---|---|---|
| Liberatore Randall P | -- | Commerce Title | |
| Ervin Sondra L | $85,000 | Stewart Title | |
| Hud | -- | Chicago Title Co | |
| Gmac Mtg Corp | $90,814 | Chicago Title Co |
Source: Public Records
Mortgage History
| Date | Status | Borrower | Loan Amount |
|---|---|---|---|
| Previous Owner | Liberatore Randall P | $82,400 | |
| Previous Owner | Ervin Sondra L | $67,600 | |
| Closed | Ervin Sondra L | $16,900 |
Source: Public Records
Tax History Compared to Growth
Tax History
| Year | Tax Paid | Tax Assessment Tax Assessment Total Assessment is a certain percentage of the fair market value that is determined by local assessors to be the total taxable value of land and additions on the property. | Land | Improvement |
|---|---|---|---|---|
| 2025 | $1,533 | $130,641 | $12,293 | $118,348 |
| 2024 | $1,533 | $128,079 | $12,052 | $116,027 |
| 2023 | $1,412 | $125,568 | $11,816 | $113,752 |
| 2022 | $1,412 | $123,106 | $11,584 | $111,522 |
| 2021 | $1,373 | $120,692 | $11,357 | $109,335 |
| 2020 | $1,348 | $119,455 | $11,241 | $108,214 |
| 2019 | $1,324 | $117,113 | $11,021 | $106,092 |
| 2018 | $1,410 | $114,817 | $10,805 | $104,012 |
| 2017 | $1,379 | $112,566 | $10,593 | $101,973 |
| 2016 | $1,350 | $110,359 | $10,385 | $99,974 |
| 2015 | -- | $108,701 | $10,229 | $98,472 |
| 2014 | $1,274 | $106,572 | $10,029 | $96,543 |
Source: Public Records
Map
Nearby Homes
- 12494 Hickory Ave
- 15788 Lindero St
- 0 Huerta St Unit IV25172021
- 0 Huerta St Unit HD24137526
- 12692 9th Ave
- 13300 11th Ave
- 15970 Lindero St
- 15826 Bear Valley Rd
- 0 Lone Eagle St
- 15577 Nisqualli Rd
- 15353 Tokay St
- 15423 Sitting Bull St
- 15315 Tokay St
- 12964 Whispering Creek Way
- 0 Bear Valley Rd
- 0 Bear Valley Rd Unit HD25167799
- 0 Bear Valley Rd Unit CV25140605
- 0 Bear Valley Rd Unit HD25094042
- 0 Bear Valley Rd Unit HD25087414
- 0 Bear Valley Rd Unit HD25074049
- 12434 Magnolia Ave
- 12425 Eleventh Ave
- 12424 Magnolia Ave
- 12470 Magnolia Ave
- 12425 11th Ave
- 12461 Magnolia Ave
- 12445 Eleventh Ave
- 12473 Magnolia Ave
- 12405 Eleventh Ave
- 12449 Magnolia Ave
- 12445 11th Ave
- 12400 Magnolia Ave
- 12486 Magnolia Ave
- 12431 Magnolia Ave
- 12451 Eleventh Ave
- 12493 Magnolia Ave
- 12451 11th Ave
- 12383 Eleventh Ave
- 12423 Magnolia Ave
- 12383 11th Ave