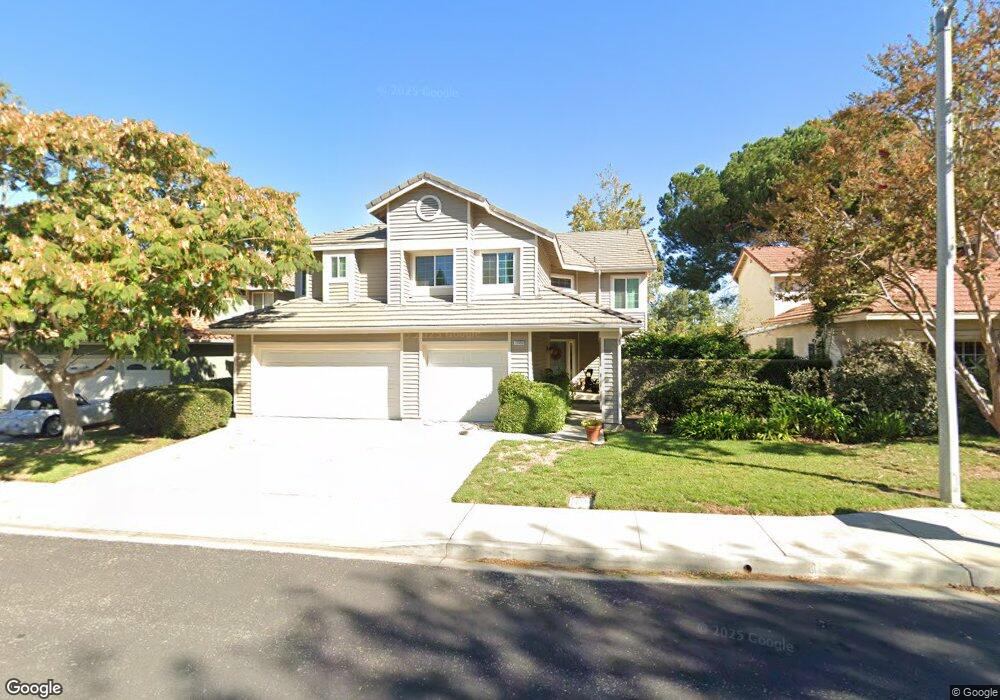
12453 Beech Grove Ct Moorpark, CA 93021
Estimated Value: $1,085,000 - $1,350,000
3
Beds
3
Baths
2,937
Sq Ft
$401/Sq Ft
Est. Value
About This Home
This home is located at 12453 Beech Grove Ct, Moorpark, CA 93021 and is currently estimated at $1,178,318, approximately $401 per square foot. 12453 Beech Grove Ct is a home located in Ventura County with nearby schools including Mountain Meadows Elementary School, Chaparral Middle School, and Moorpark High School.
Ownership History
Date
Name
Owned For
Owner Type
Purchase Details
Closed on
Jan 22, 2021
Sold by
Anderson David Hans and Anderson Maureen Kay
Bought by
Anderson Maureen Kay and Anderson David Hans
Current Estimated Value
Home Financials for this Owner
Home Financials are based on the most recent Mortgage that was taken out on this home.
Original Mortgage
$390,000
Outstanding Balance
$350,416
Interest Rate
3.1%
Mortgage Type
New Conventional
Estimated Equity
$827,902
Purchase Details
Closed on
Dec 3, 2014
Sold by
Anderson David H and Anderson Maureen K
Bought by
Anderson Family 2014 Revocable Trust and Anderson Maureen Kay
Purchase Details
Closed on
Dec 31, 2003
Sold by
Herrera Robert Manuel and Herrera Esther Mary
Bought by
Anderson David H and Anderson Maureen Kay
Create a Home Valuation Report for This Property
The Home Valuation Report is an in-depth analysis detailing your home's value as well as a comparison with similar homes in the area
Home Values in the Area
Average Home Value in this Area
Purchase History
| Date | Buyer | Sale Price | Title Company |
|---|---|---|---|
| Anderson Maureen Kay | -- | Orange Coast Lender Services | |
| Anderson Family 2014 Revocable Trust | -- | None Available | |
| Anderson David H | $275,000 | First American Title Co |
Source: Public Records
Mortgage History
| Date | Status | Borrower | Loan Amount |
|---|---|---|---|
| Open | Anderson Maureen Kay | $390,000 |
Source: Public Records
Tax History Compared to Growth
Tax History
| Year | Tax Paid | Tax Assessment Tax Assessment Total Assessment is a certain percentage of the fair market value that is determined by local assessors to be the total taxable value of land and additions on the property. | Land | Improvement |
|---|---|---|---|---|
| 2025 | $5,223 | $484,506 | $168,441 | $316,065 |
| 2024 | $5,223 | $475,006 | $165,138 | $309,868 |
| 2023 | $5,108 | $465,693 | $161,900 | $303,793 |
| 2022 | $4,976 | $456,562 | $158,725 | $297,837 |
| 2021 | $4,965 | $447,610 | $155,612 | $291,998 |
| 2020 | $4,918 | $443,021 | $154,017 | $289,004 |
| 2019 | $4,809 | $434,336 | $150,998 | $283,338 |
| 2018 | $4,759 | $425,821 | $148,038 | $277,783 |
| 2017 | $4,661 | $417,473 | $145,136 | $272,337 |
| 2016 | $4,572 | $409,289 | $142,291 | $266,998 |
| 2015 | $4,510 | $403,143 | $140,154 | $262,989 |
| 2014 | $4,388 | $395,248 | $137,409 | $257,839 |
Source: Public Records
Map
Nearby Homes
- 12441 Beech Grove Ct
- 12576 Cherry Grove St
- 4007 Doneva Rd
- 12496 Arbor Hill St
- 12490 Spring Creek Rd
- 3891 Hunters Grove Ct
- 3866 Hunter Crest Ct
- 4028 Cliffrose Ave
- 11928 River Grove Ct
- 11860 Alderbrook St
- 12401 Willow Forest Dr
- 12493 Presilla Rd
- 4471 Skyglen Ct
- 4429 Summerglen Ct
- 12127 Presilla Rd
- 13191 Honeybee St
- 4529 N Canyonlands Rd
- 4506 N Canyonlands Rd
- 3821 Hidden Pine Ct
- 11657 Blossomwood Ct
- 12461 Beech Grove Ct
- 12467 Beechgrove Ct
- 12429 Beech Grove Ct
- 12467 Beech Grove Ct
- 12417 Beech Grove Ct
- 12479 Beech Grove Ct
- 12454 Beech Grove Ct
- 12442 Beech Grove Ct
- 12460 Beech Grove Ct
- 12443 Misty Grove St
- 12466 Beechgrove Ct
- 12455 Misty Grove St
- 12430 Beech Grove Ct
- 12431 Misty Grove St
- 12466 Beech Grove Ct
- 12467 Misty Grove St
- 12485 Beech Grove Ct
- 12405 Beech Grove Ct
- 12419 Misty Grove St
- 12418 Beech Grove Ct