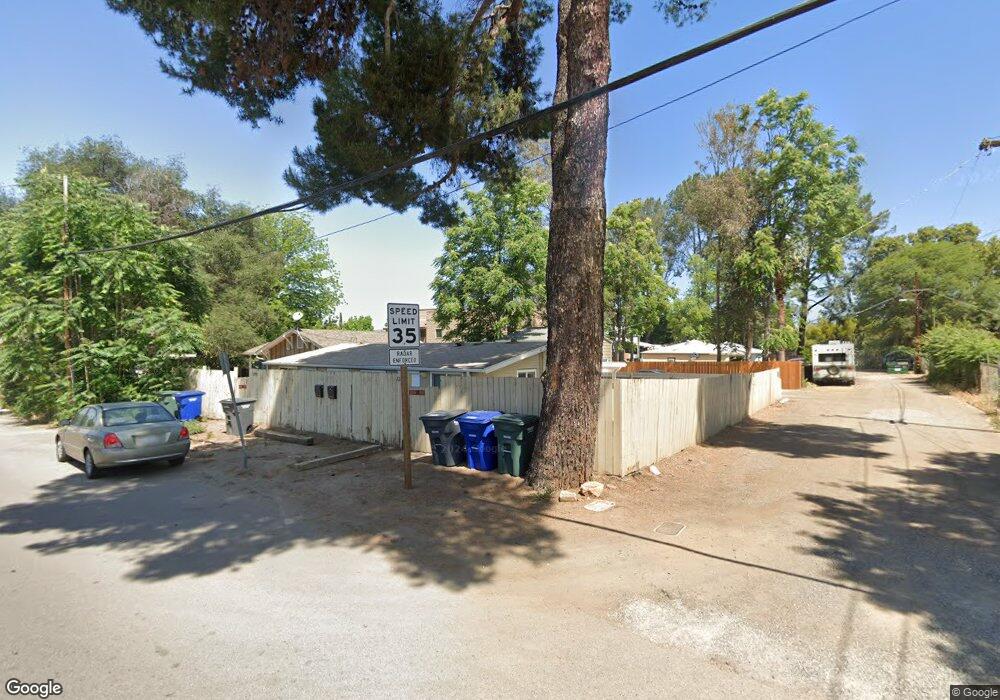
12454 Julian Ave Unit 56 Lakeside, CA 92040
Lakeview NeighborhoodEstimated Value: $693,000 - $820,000
2
Beds
2
Baths
900
Sq Ft
$845/Sq Ft
Est. Value
About This Home
This home is located at 12454 Julian Ave Unit 56, Lakeside, CA 92040 and is currently estimated at $760,359, approximately $844 per square foot. 12454 Julian Ave Unit 56 is a home located in San Diego County with nearby schools including Lemon Crest Elementary School, Tierra Del Sol Middle School, and El Capitan High School.
Ownership History
Date
Name
Owned For
Owner Type
Purchase Details
Closed on
Apr 28, 2016
Sold by
Baker Jesse M
Bought by
Schoonmaker Schuyler
Current Estimated Value
Home Financials for this Owner
Home Financials are based on the most recent Mortgage that was taken out on this home.
Original Mortgage
$270,000
Outstanding Balance
$214,377
Interest Rate
3.58%
Mortgage Type
New Conventional
Estimated Equity
$545,982
Purchase Details
Closed on
Jan 16, 2014
Sold by
Baker Kelly
Bought by
Baker Jesse M
Home Financials for this Owner
Home Financials are based on the most recent Mortgage that was taken out on this home.
Original Mortgage
$206,196
Interest Rate
3.25%
Mortgage Type
FHA
Purchase Details
Closed on
Dec 30, 2013
Sold by
Lewallen Properties Llc
Bought by
Baker Jesse M
Home Financials for this Owner
Home Financials are based on the most recent Mortgage that was taken out on this home.
Original Mortgage
$206,196
Interest Rate
3.25%
Mortgage Type
FHA
Purchase Details
Closed on
Jun 26, 2011
Sold by
Lewallen Robert B and Lewallen Deborah S
Bought by
Lewallen William E and Lewallen Diana A
Purchase Details
Closed on
Nov 24, 2010
Sold by
Skandunas Esther V
Bought by
Skandunas Vince J
Purchase Details
Closed on
Aug 6, 2010
Sold by
Skandunas Vince J
Bought by
Lewallen Robert B and Lewallen Deborah S
Purchase Details
Closed on
Oct 26, 2004
Sold by
Skandunas Vince J and Skandunas Maritza V
Bought by
Skandunas Vince J
Home Financials for this Owner
Home Financials are based on the most recent Mortgage that was taken out on this home.
Original Mortgage
$202,000
Interest Rate
6.37%
Mortgage Type
New Conventional
Purchase Details
Closed on
Mar 11, 2003
Sold by
Saylors Winford C
Bought by
Skandunas Vince J and Skandunas Vince J
Home Financials for this Owner
Home Financials are based on the most recent Mortgage that was taken out on this home.
Original Mortgage
$202,500
Interest Rate
7.25%
Purchase Details
Closed on
Sep 30, 1998
Sold by
Saylors Laurie J
Bought by
Saylors Winford C
Purchase Details
Closed on
Feb 28, 1997
Sold by
Shaffman Mary J
Bought by
Saylors Winford C and Saylors Laurie J
Home Financials for this Owner
Home Financials are based on the most recent Mortgage that was taken out on this home.
Original Mortgage
$66,700
Interest Rate
7.63%
Create a Home Valuation Report for This Property
The Home Valuation Report is an in-depth analysis detailing your home's value as well as a comparison with similar homes in the area
Home Values in the Area
Average Home Value in this Area
Purchase History
| Date | Buyer | Sale Price | Title Company |
|---|---|---|---|
| Schoonmaker Schuyler | $300,000 | Title 365 | |
| Baker Jesse M | -- | California Title Company | |
| Baker Jesse M | $210,000 | California Title Company | |
| Lewallen Properties Llc | -- | California Title Company | |
| Lewallen William E | -- | None Available | |
| Skandunas Vince J | -- | Ticor Title Company | |
| Lewallen Robert B | $120,000 | Ticor Title Company | |
| Skandunas Vince J | -- | Chicago Title Co | |
| Skandunas Vince J | $220,000 | California Title Company | |
| Saylors Winford C | -- | -- | |
| Saylors Winford C | $89,000 | Commonwealth Land Title Co |
Source: Public Records
Mortgage History
| Date | Status | Borrower | Loan Amount |
|---|---|---|---|
| Open | Schoonmaker Schuyler | $270,000 | |
| Previous Owner | Baker Jesse M | $206,196 | |
| Previous Owner | Skandunas Vince J | $202,000 | |
| Previous Owner | Skandunas Vince J | $202,500 | |
| Previous Owner | Saylors Winford C | $66,700 | |
| Closed | Skandunas Vince J | $86,000 |
Source: Public Records
Tax History Compared to Growth
Tax History
| Year | Tax Paid | Tax Assessment Tax Assessment Total Assessment is a certain percentage of the fair market value that is determined by local assessors to be the total taxable value of land and additions on the property. | Land | Improvement |
|---|---|---|---|---|
| 2025 | $10,015 | $753,455 | $301,378 | $452,077 |
| 2024 | $10,015 | $738,682 | $295,469 | $443,213 |
| 2023 | $9,646 | $724,199 | $289,676 | $434,523 |
| 2022 | $5,025 | $334,651 | $133,859 | $200,792 |
| 2021 | $4,970 | $328,090 | $131,235 | $196,855 |
| 2020 | $4,860 | $324,727 | $129,890 | $194,837 |
| 2019 | $4,771 | $318,361 | $127,344 | $191,017 |
| 2018 | $4,643 | $312,120 | $124,848 | $187,272 |
| 2017 | $820 | $306,000 | $122,400 | $183,600 |
| 2016 | $3,376 | $217,461 | $126,852 | $90,609 |
| 2015 | $3,347 | $214,195 | $124,947 | $89,248 |
| 2014 | $2,225 | $125,414 | $73,158 | $52,256 |
Source: Public Records
Map
Nearby Homes
- 12429 Julian Ave
- 12525 Julian Ave
- 12507 Castle Court Dr
- 9620 Los Coches Rd
- 9825 Maine Ave
- 12643 Castle Court Dr
- 9924 Vine St
- 12740 Casa Vista Rd
- 12370 Lakeshore Dr
- 12515 Leyendekker Rd
- 12366 Lakeshore Dr
- 9753 Shamrock Ln
- 9731 Winter Gardens Blvd Unit 57
- 9719 Winter Gardens Blvd Unit 163
- 9739 Winter Gardens Blvd Unit 10
- 9731 Winter Gardens Blvd Unit 54
- 12616 Lakeshore Dr
- 9611 Kumquat Dr
- 9607 Kumquat Dr
- 12650 Lakeshore Dr Unit 115
- 12456 Julian Ave
- 12462 Julian Ave Unit 68
- 9705 Cactus St
- 12458 Julian Ave Unit 60
- 9717 Cactus St
- 12459 Julian Ave
- 12439 Julian Ave Unit 45
- 12439-12445 Julian Ave
- 12482 Julian Ave
- 9721 Cactus St
- 12501 Julian Ave
- 9731 Cactus St
- 9748 Los Coches Rd
- 12506 Julian Ave
- 12433 Julian Ave Unit 4
- 12560 Lemon Crest Dr
- 12511 Julian Ave
- 9735 Cactus St Unit F
- 9735 Cactus St
- 9737 Cactus St