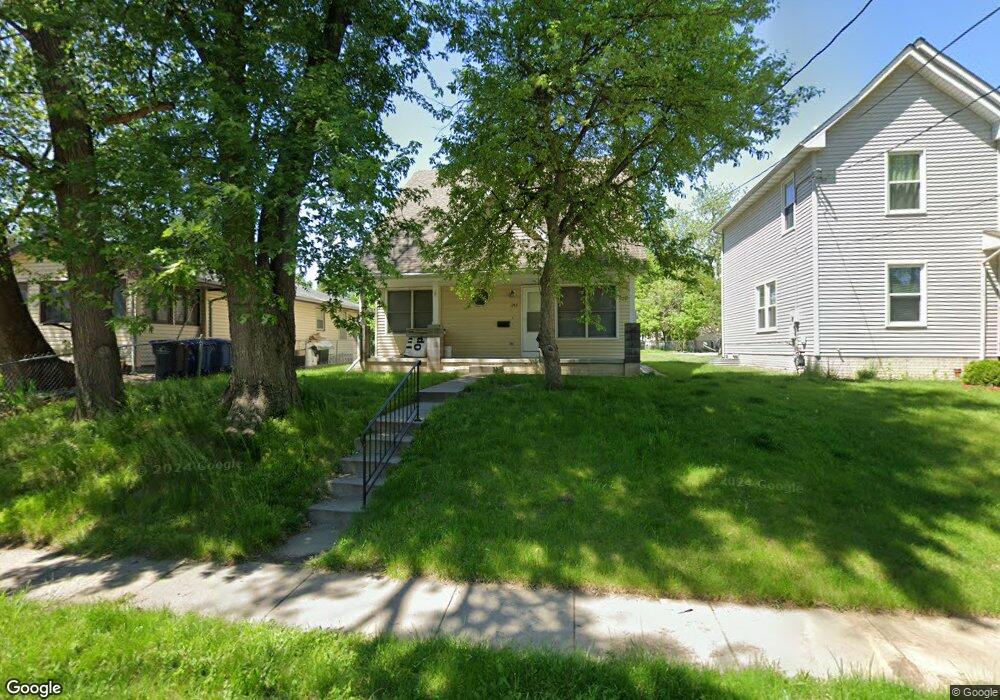
1246 10th St Des Moines, IA 50314
King Irving NeighborhoodEstimated Value: $158,625 - $185,000
3
Beds
1
Bath
1,092
Sq Ft
$160/Sq Ft
Est. Value
About This Home
This home is located at 1246 10th St, Des Moines, IA 50314 and is currently estimated at $174,406, approximately $159 per square foot. 1246 10th St is a home located in Polk County with nearby schools including Moulton Elementary School, Harding Middle School, and North High School.
Ownership History
Date
Name
Owned For
Owner Type
Purchase Details
Closed on
Aug 25, 2013
Sold by
Home Opportunities Made Easy Inc
Bought by
Do Nick
Current Estimated Value
Home Financials for this Owner
Home Financials are based on the most recent Mortgage that was taken out on this home.
Original Mortgage
$58,650
Outstanding Balance
$43,616
Interest Rate
4.39%
Mortgage Type
New Conventional
Estimated Equity
$130,790
Purchase Details
Closed on
Nov 8, 2010
Sold by
City Of Des Moines Iowa Municipal Housin
Bought by
Home Opportunities Made Easy Inc
Create a Home Valuation Report for This Property
The Home Valuation Report is an in-depth analysis detailing your home's value as well as a comparison with similar homes in the area
Home Values in the Area
Average Home Value in this Area
Purchase History
| Date | Buyer | Sale Price | Title Company |
|---|---|---|---|
| Do Nick | $111,000 | None Available | |
| Home Opportunities Made Easy Inc | $64,500 | None Available |
Source: Public Records
Mortgage History
| Date | Status | Borrower | Loan Amount |
|---|---|---|---|
| Open | Do Nick | $58,650 |
Source: Public Records
Tax History Compared to Growth
Tax History
| Year | Tax Paid | Tax Assessment Tax Assessment Total Assessment is a certain percentage of the fair market value that is determined by local assessors to be the total taxable value of land and additions on the property. | Land | Improvement |
|---|---|---|---|---|
| 2025 | $2,266 | $144,800 | $13,700 | $131,100 |
| 2024 | $2,266 | $125,700 | $11,700 | $114,000 |
| 2023 | $2,000 | $125,700 | $11,700 | $114,000 |
| 2022 | $1,982 | $93,700 | $8,900 | $84,800 |
| 2021 | $1,886 | $93,700 | $8,900 | $84,800 |
| 2020 | $1,954 | $84,200 | $7,900 | $76,300 |
| 2019 | $1,846 | $84,200 | $7,900 | $76,300 |
| 2018 | $1,822 | $77,200 | $7,100 | $70,100 |
| 2017 | $1,880 | $77,200 | $7,100 | $70,100 |
| 2016 | $1,826 | $78,000 | $7,100 | $70,900 |
| 2015 | $1,826 | $78,000 | $7,100 | $70,900 |
| 2014 | $1,742 | $68,000 | $7,000 | $61,000 |
Source: Public Records
Map
Nearby Homes