1246 E Tam o Shanter St Ontario, CA 91761
Ontario Ranch NeighborhoodEstimated Value: $712,357 - $756,000
4
Beds
2
Baths
1,733
Sq Ft
$424/Sq Ft
Est. Value
About This Home
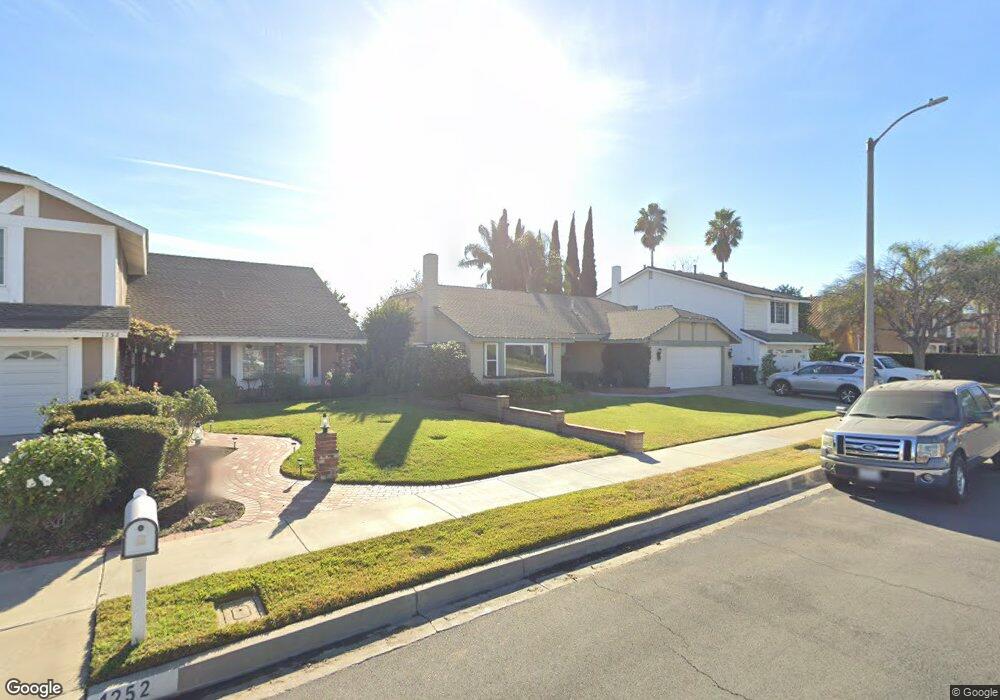
This home is located at 1246 E Tam o Shanter St, Ontario, CA 91761 and is currently estimated at $735,589, approximately $424 per square foot. 1246 E Tam o Shanter St is a home located in San Bernardino County with nearby schools including Levi H. Dickey Elementary School, Woodcrest Junior High, and Chino High School.
Ownership History
Date
Name
Owned For
Owner Type
Purchase Details
Closed on
Nov 16, 2001
Sold by
Shaughn Brian
Bought by
Cooper Vincent P and Cooper Kathleen M
Current Estimated Value
Home Financials for this Owner
Home Financials are based on the most recent Mortgage that was taken out on this home.
Original Mortgage
$202,950
Outstanding Balance
$77,392
Interest Rate
6.39%
Estimated Equity
$658,197
Purchase Details
Closed on
Sep 8, 2000
Sold by
Ingles Ingles Darla Darla
Bought by
Shaughn Brian and Shaughn Nori M
Home Financials for this Owner
Home Financials are based on the most recent Mortgage that was taken out on this home.
Original Mortgage
$135,000
Interest Rate
7.9%
Purchase Details
Closed on
Jun 17, 1996
Sold by
Pardee Gregory T
Bought by
Ingles Darla
Home Financials for this Owner
Home Financials are based on the most recent Mortgage that was taken out on this home.
Original Mortgage
$120,400
Interest Rate
8.09%
Create a Home Valuation Report for This Property
The Home Valuation Report is an in-depth analysis detailing your home's value as well as a comparison with similar homes in the area
Home Values in the Area
Average Home Value in this Area
Purchase History
| Date | Buyer | Sale Price | Title Company |
|---|---|---|---|
| Cooper Vincent P | $209,500 | Fidelity National Title Ins | |
| Shaughn Brian | $180,000 | American Title | |
| Westhuis Darla Ingles | -- | American Title | |
| Ingles Darla | $150,500 | Northern Counties Title |
Source: Public Records
Mortgage History
| Date | Status | Borrower | Loan Amount |
|---|---|---|---|
| Open | Cooper Vincent P | $202,950 | |
| Previous Owner | Shaughn Brian | $135,000 | |
| Previous Owner | Ingles Darla | $120,400 |
Source: Public Records
Tax History Compared to Growth
Tax History
| Year | Tax Paid | Tax Assessment Tax Assessment Total Assessment is a certain percentage of the fair market value that is determined by local assessors to be the total taxable value of land and additions on the property. | Land | Improvement |
|---|---|---|---|---|
| 2025 | $3,335 | $309,497 | $108,323 | $201,174 |
| 2024 | $3,335 | $303,428 | $106,199 | $197,229 |
| 2023 | $3,243 | $297,479 | $104,117 | $193,362 |
| 2022 | $3,223 | $291,646 | $102,075 | $189,571 |
| 2021 | $3,159 | $285,928 | $100,074 | $185,854 |
| 2020 | $3,118 | $282,996 | $99,048 | $183,948 |
| 2019 | $3,063 | $277,447 | $97,106 | $180,341 |
| 2018 | $2,995 | $272,007 | $95,202 | $176,805 |
| 2017 | $2,941 | $266,673 | $93,335 | $173,338 |
| 2016 | $2,750 | $261,444 | $91,505 | $169,939 |
| 2015 | $2,695 | $257,517 | $90,131 | $167,386 |
| 2014 | $2,641 | $252,472 | $88,365 | $164,107 |
Source: Public Records
Map
Nearby Homes
- 2708 S Parkside Dr
- 2535 S Imperial Place
- 2413 S Parco Ave
- 2453 S Marigold Place
- 2817 S Lassen Ave
- 2424 S Lake Ave
- 1020 E Tam o Shanter Ct
- 2437 S Garfield Place
- 1557 E Cherry Hill St
- 1456 E Philadelphia St Unit 134
- 1456 E Philadelphia St Unit 378
- 1456 E Philadelphia St
- 1456 E Philadelphia St Unit 218
- 1456 E Philadelphia St Unit 279
- 1456 E Philadelphia St Unit 132
- 1456 E Philadelphia St Unit 39
- 1456 E Philadelphia St Unit 41
- 1456 E Philadelphia St Unit 311
- 1456 E Philadelphia St Unit 158
- 1456 E Philadelphia St Unit 109
- 1252 E Tam o Shanter St
- 1240 E Tam o Shanter St
- 1258 E Tam o Shanter St
- 2639 S Calaveras Place
- 2638 S Calaveras Place
- 1226 E Tam o Shanter St
- 2650 S Del Norte Ave
- 2702 S Del Norte Ave
- 2633 S Calaveras Place
- 2632 S Calaveras Place
- 2632 S Calaveras Place
- 2708 S Del Norte Ave
- 1220 E Tam o Shanter St
- 2638 S Del Norte Ave
- 2639 S Amador Place
- 2714 S Del Norte Ave
- 2627 S Calaveras Place
- 2626 S Calaveras Place
- 1214 E Tam o Shanter St
- 2633 S Amador Place