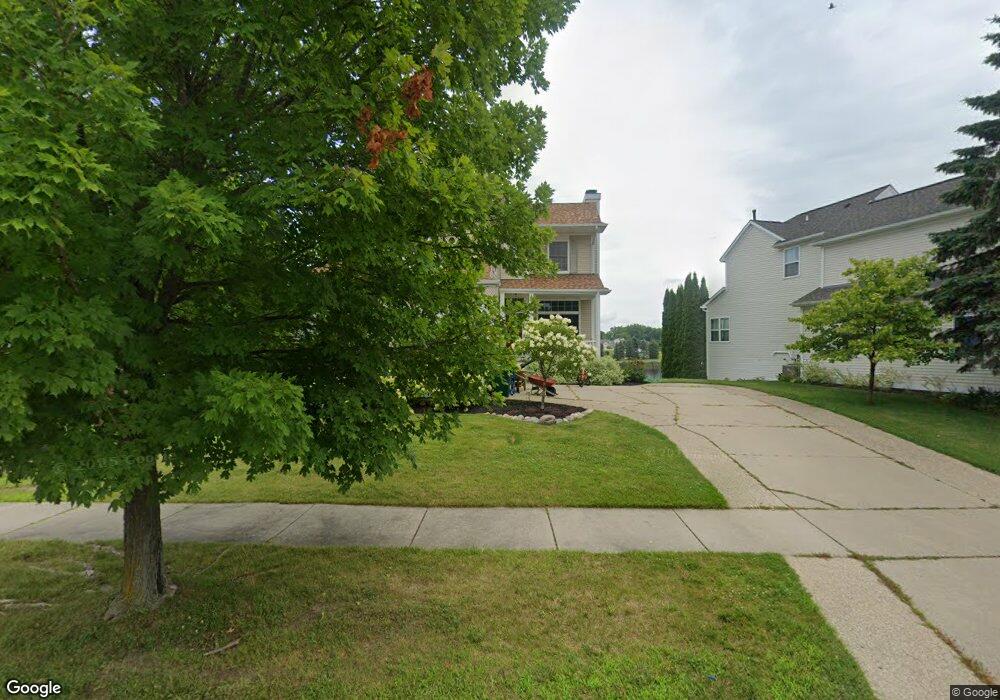
1246 Fountain View Ln Unit 65 Oxford, MI 48371
Estimated Value: $385,705 - $480,000
3
Beds
3
Baths
1,687
Sq Ft
$254/Sq Ft
Est. Value
About This Home
This home is located at 1246 Fountain View Ln Unit 65, Oxford, MI 48371 and is currently estimated at $427,926, approximately $253 per square foot. 1246 Fountain View Ln Unit 65 is a home located in Oakland County with nearby schools including Oxford Elementary School, Daniel Axford Elementary School, and Oxford Middle School.
Ownership History
Date
Name
Owned For
Owner Type
Purchase Details
Closed on
Apr 25, 2013
Sold by
Borck Wilbert I and Borck Mary Ane
Bought by
Blaszcyk Kathryn R and Blaszcyd Thaddeus G
Current Estimated Value
Home Financials for this Owner
Home Financials are based on the most recent Mortgage that was taken out on this home.
Original Mortgage
$138,578
Interest Rate
3.56%
Mortgage Type
FHA
Purchase Details
Closed on
Jul 15, 2008
Sold by
Rodak Joyce A
Bought by
Deutsche Bank Trust Co Americas
Purchase Details
Closed on
Oct 28, 2005
Sold by
Rodak Mark A
Bought by
Rodak Joyce A
Purchase Details
Closed on
Jul 24, 2002
Sold by
Rodak Mark A
Bought by
Rodak Joyce A
Purchase Details
Closed on
May 3, 2001
Sold by
Delcor Homes Oxford I
Bought by
Rodak Mark A
Home Financials for this Owner
Home Financials are based on the most recent Mortgage that was taken out on this home.
Original Mortgage
$25,200
Interest Rate
7.18%
Create a Home Valuation Report for This Property
The Home Valuation Report is an in-depth analysis detailing your home's value as well as a comparison with similar homes in the area
Home Values in the Area
Average Home Value in this Area
Purchase History
| Date | Buyer | Sale Price | Title Company |
|---|---|---|---|
| Blaszcyk Kathryn R | -- | First American Title Ins Co | |
| Deutsche Bank Trust Co Americas | $140,250 | None Available | |
| Rodak Joyce A | -- | Battersby Title Inc | |
| Rodak Joyce A | -- | -- | |
| Rodak Mark A | $65,000 | -- |
Source: Public Records
Mortgage History
| Date | Status | Borrower | Loan Amount |
|---|---|---|---|
| Previous Owner | Blaszcyk Kathryn R | $138,578 | |
| Previous Owner | Rodak Mark A | $25,200 |
Source: Public Records
Tax History Compared to Growth
Tax History
| Year | Tax Paid | Tax Assessment Tax Assessment Total Assessment is a certain percentage of the fair market value that is determined by local assessors to be the total taxable value of land and additions on the property. | Land | Improvement |
|---|---|---|---|---|
| 2024 | $2,258 | $165,970 | $0 | $0 |
| 2023 | $2,153 | $141,290 | $0 | $0 |
| 2022 | $3,332 | $129,840 | $0 | $0 |
| 2021 | $3,185 | $123,170 | $0 | $0 |
| 2020 | $2,034 | $117,100 | $0 | $0 |
| 2019 | $2,973 | $111,100 | $0 | $0 |
| 2018 | $2,917 | $104,410 | $0 | $0 |
| 2017 | $2,802 | $104,190 | $0 | $0 |
| 2016 | $2,796 | $102,820 | $0 | $0 |
| 2015 | -- | $95,740 | $0 | $0 |
| 2014 | -- | $86,580 | $0 | $0 |
| 2011 | -- | $67,600 | $0 | $0 |
Source: Public Records
Map
Nearby Homes
- 1172 Fountain View Ln Unit 72
- 302 Tanview Dr
- 254 Cross Timbers St
- 682 Westlake Ave
- 622 Westlake Ave
- 778 W Peninsula Ct
- 720 Marlayna Dr
- 1611 Harwood Dr
- 372 Overlook Dr
- 1858 Sandy Shores Dr
- 587 Eastlake Trail
- 822 Westlake Ave
- 1904 Sandy Shores Dr
- 1974 Sandy Shores Dr
- 35 West St
- 65 1st St
- 778 Hilberg St
- 967 Keith St
- 2338 Malena Ln
- 1320 W Drahner Rd
- 1236 Fountain View Ln Unit 66
- 1262 Fountain View Ln
- 1214 Fountain View Ln
- 1253 Fountain View Ln
- 1243 Fountain View Ln Unit 39
- 1263 Pondview Ln Unit 41
- 1233 Fountain View Ln
- 1223 Fountain View Ln Unit 37
- 1293 Fountain View Ln
- 1202 Fountain View Ln Unit 69
- 1213 Fountain View Ln Unit 36
- 1303 Fountain View Ln Unit 89
- 00 Tanview Dr
- 0 Tanview Dr Unit 215074922
- 0 Tanview Dr
- 0 Tanview Dr Unit R215074929
- 1192 Fountain View Ln Unit 70
- 1203 Fountain View Ln Unit 35
- 1288 Pondview Ln Unit 62
- 1313 Fountain View Ln