K
Seller's Agent in 2014
KEN KIRKEBY
INACTIVE OFFICE
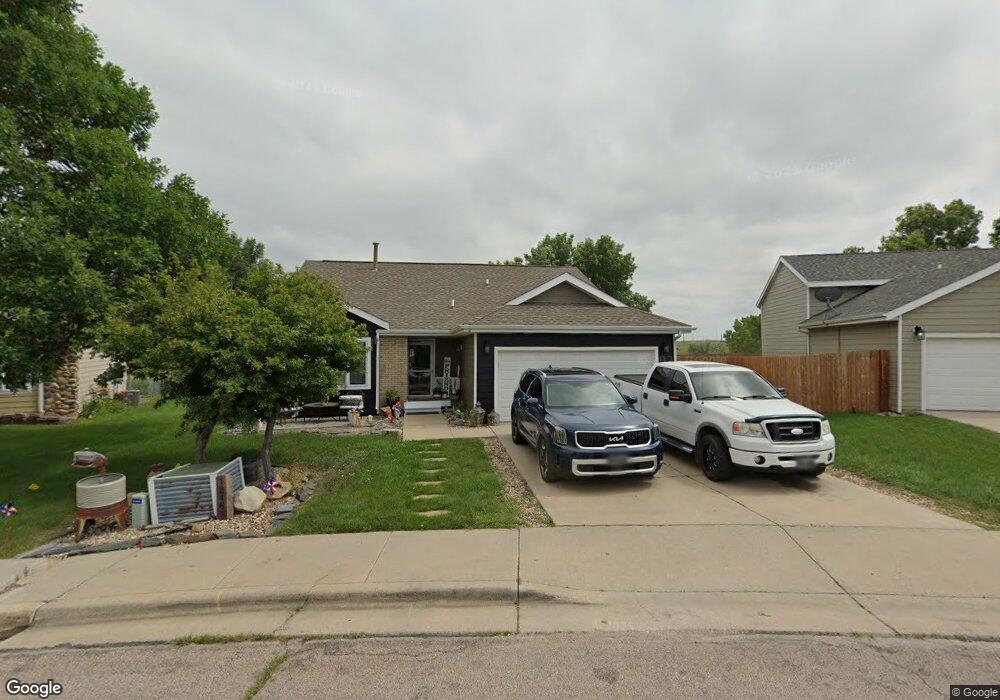
Estimated Value: $343,000 - $418,000
Under contract before MLS listing
Last Agent to Sell the Property
KEN KIRKEBY
INACTIVE OFFICE Listed on: 05/28/2014
Last Buyer's Agent
Gail Foerster
INACTIVE OFFICE
| Date | Buyer | Sale Price | Title Company |
|---|---|---|---|
| Clucas Kerri E | -- | -- |
| Date | Status | Borrower | Loan Amount |
|---|---|---|---|
| Open | Clucas Kerri E | $173,302 |
| Date | Event | Price | List to Sale | Price per Sq Ft |
|---|---|---|---|---|
| 07/30/2014 07/30/14 | Sold | $176,500 | 0.0% | $102 / Sq Ft |
| 05/28/2014 05/28/14 | Pending | -- | -- | -- |
| 05/28/2014 05/28/14 | For Sale | $176,500 | -- | $102 / Sq Ft |
| Year | Tax Paid | Tax Assessment Tax Assessment Total Assessment is a certain percentage of the fair market value that is determined by local assessors to be the total taxable value of land and additions on the property. | Land | Improvement |
|---|---|---|---|---|
| 2025 | $3,560 | $326,900 | $47,600 | $279,300 |
| 2024 | $3,560 | $319,400 | $47,600 | $271,800 |
| 2023 | $3,361 | $294,700 | $47,600 | $247,100 |
| 2022 | $3,085 | $251,300 | $41,400 | $209,900 |
| 2021 | $2,935 | $215,100 | $41,400 | $173,700 |
| 2020 | $2,774 | $196,900 | $41,400 | $155,500 |
| 2019 | $2,584 | $182,700 | $36,300 | $146,400 |
| 2018 | $2,530 | $178,500 | $36,300 | $142,200 |
| 2017 | $2,436 | $182,800 | $36,300 | $146,500 |
| 2016 | $2,542 | $167,800 | $36,300 | $131,500 |
| 2015 | $2,542 | $170,900 | $36,300 | $134,600 |
| 2014 | $3,206 | $164,300 | $36,300 | $128,000 |
K
Seller's Agent in 2014
KEN KIRKEBY
INACTIVE OFFICE
G
Buyer's Agent in 2014
Gail Foerster
INACTIVE OFFICE
Source: Black Hills Association of REALTORS®
MLS Number: 118479
APN: 0063921
Disclaimer: Certain information contained herein is derived from information provided by parties other than Homes.com. All information provided is deemed reliable, but is not guaranteed to be accurate and should be independently verified.
![]() IDX information is provided exclusively for personal, non-commercial use, and may not be used for any purpose other than to identify prospective properties consumers may be interested in purchasing. Information is deemed reliable but not guaranteed.
IDX information is provided exclusively for personal, non-commercial use, and may not be used for any purpose other than to identify prospective properties consumers may be interested in purchasing. Information is deemed reliable but not guaranteed.
