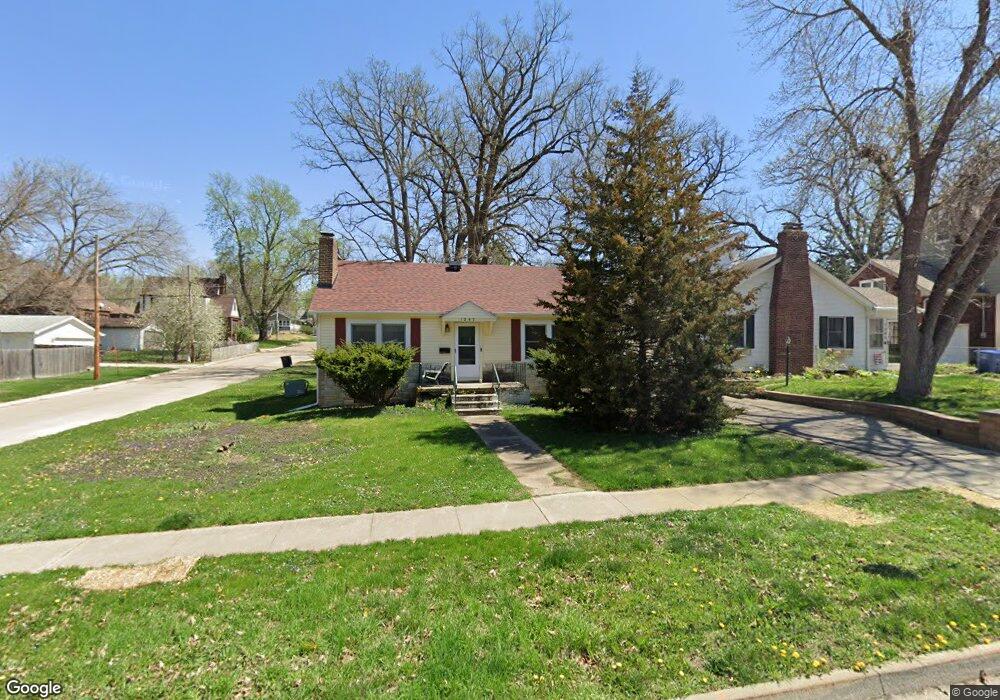
1247 48th St Des Moines, IA 50311
Waveland Park NeighborhoodEstimated Value: $171,000 - $200,000
2
Beds
1
Bath
884
Sq Ft
$214/Sq Ft
Est. Value
About This Home
This home is located at 1247 48th St, Des Moines, IA 50311 and is currently estimated at $189,069, approximately $213 per square foot. 1247 48th St is a home located in Polk County with nearby schools including Perkins Elementary School, Merrill Middle School, and Roosevelt High School.
Ownership History
Date
Name
Owned For
Owner Type
Purchase Details
Closed on
Oct 24, 2005
Sold by
Rider Jennifer M
Bought by
Burnette Shannon L
Current Estimated Value
Home Financials for this Owner
Home Financials are based on the most recent Mortgage that was taken out on this home.
Original Mortgage
$98,100
Outstanding Balance
$50,373
Interest Rate
5.12%
Mortgage Type
Fannie Mae Freddie Mac
Estimated Equity
$138,696
Purchase Details
Closed on
Nov 19, 1998
Sold by
Bennett Marvin R and Bennett Linda E
Bought by
Rider Jennifer M
Home Financials for this Owner
Home Financials are based on the most recent Mortgage that was taken out on this home.
Original Mortgage
$69,719
Interest Rate
6.59%
Mortgage Type
FHA
Create a Home Valuation Report for This Property
The Home Valuation Report is an in-depth analysis detailing your home's value as well as a comparison with similar homes in the area
Home Values in the Area
Average Home Value in this Area
Purchase History
| Date | Buyer | Sale Price | Title Company |
|---|---|---|---|
| Burnette Shannon L | $108,500 | -- | |
| Rider Jennifer M | $69,500 | -- |
Source: Public Records
Mortgage History
| Date | Status | Borrower | Loan Amount |
|---|---|---|---|
| Open | Burnette Shannon L | $98,100 | |
| Previous Owner | Rider Jennifer M | $69,719 |
Source: Public Records
Tax History
| Year | Tax Paid | Tax Assessment Tax Assessment Total Assessment is a certain percentage of the fair market value that is determined by local assessors to be the total taxable value of land and additions on the property. | Land | Improvement |
|---|---|---|---|---|
| 2025 | $2,732 | $168,000 | $48,000 | $120,000 |
| 2024 | $2,732 | $149,300 | $42,500 | $106,800 |
| 2023 | $2,802 | $149,300 | $42,500 | $106,800 |
| 2022 | $2,780 | $127,800 | $37,600 | $90,200 |
| 2021 | $2,686 | $127,800 | $37,600 | $90,200 |
| 2020 | $2,784 | $116,200 | $34,300 | $81,900 |
| 2019 | $3,122 | $116,200 | $34,300 | $81,900 |
| 2018 | $3,086 | $124,700 | $30,000 | $94,700 |
| 2017 | $2,802 | $124,700 | $30,000 | $94,700 |
| 2016 | $2,724 | $112,100 | $26,900 | $85,200 |
| 2015 | $2,724 | $112,100 | $26,900 | $85,200 |
| 2014 | $2,456 | $104,800 | $24,900 | $79,900 |
Source: Public Records
Map
Nearby Homes
- 1310 47th St
- 1346 48th St
- 1434 48th St
- 1426 45th St
- 1347 44th St
- 4902 University Ave Unit 335
- 1236 43rd St
- 1343 43rd St
- 1331 43rd St
- 1604 45th St
- 1331 42nd St
- 1716 47th St
- 1534 41st St
- 1804 47th St
- 1529 41st St
- 4200 Kingman Blvd
- 4000 University Ave Unit 7
- 3936 University Ave Unit 3
- 3932 University Ave Unit 2
- 1828 46th St
Your Personal Tour Guide
Ask me questions while you tour the home.