Estimated Value: $155,000 - $167,000
3
Beds
1
Bath
896
Sq Ft
$180/Sq Ft
Est. Value
About This Home
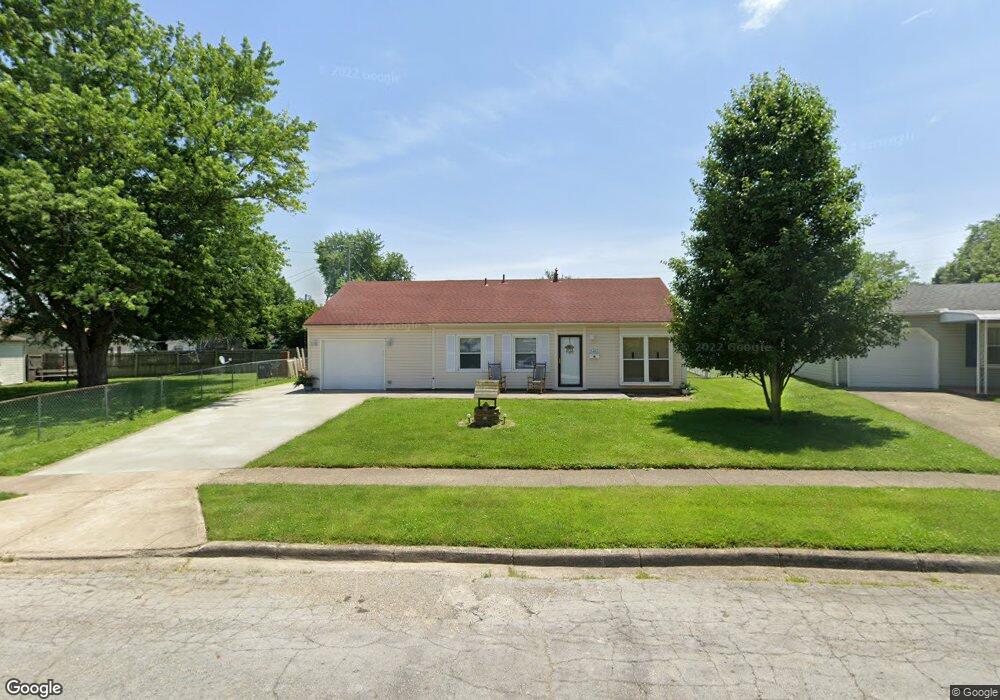
This home is located at 1247 Bingham Dr, Xenia, OH 45385 and is currently estimated at $161,174, approximately $179 per square foot. 1247 Bingham Dr is a home located in Greene County with nearby schools including Xenia High School, Summit Academy Community School for Alternative Learners - Xenia, and Legacy Christian Academy.
Ownership History
Date
Name
Owned For
Owner Type
Purchase Details
Closed on
Dec 22, 2020
Sold by
Lawson Sally A
Bought by
Lawson Sally A and Woodrum Brian Allen
Current Estimated Value
Purchase Details
Closed on
Jan 9, 2018
Sold by
Lawson Sally A
Bought by
Woodrum Brian A
Purchase Details
Closed on
Dec 18, 2017
Sold by
Lawson Richard T
Bought by
Lawson Sally A
Purchase Details
Closed on
May 24, 1999
Sold by
Rumbaugh Ora and Rumbaugh Ora Lou
Bought by
Lawson Richard T and Lawson Sally A
Home Financials for this Owner
Home Financials are based on the most recent Mortgage that was taken out on this home.
Original Mortgage
$70,379
Interest Rate
6.92%
Mortgage Type
VA
Create a Home Valuation Report for This Property
The Home Valuation Report is an in-depth analysis detailing your home's value as well as a comparison with similar homes in the area
Home Values in the Area
Average Home Value in this Area
Purchase History
| Date | Buyer | Sale Price | Title Company |
|---|---|---|---|
| Lawson Sally A | -- | None Available | |
| Woodrum Brian A | -- | -- | |
| Lawson Sally A | -- | -- | |
| Lawson Richard T | $69,000 | Safemark Title Agency Inc |
Source: Public Records
Mortgage History
| Date | Status | Borrower | Loan Amount |
|---|---|---|---|
| Previous Owner | Lawson Richard T | $70,379 |
Source: Public Records
Tax History Compared to Growth
Tax History
| Year | Tax Paid | Tax Assessment Tax Assessment Total Assessment is a certain percentage of the fair market value that is determined by local assessors to be the total taxable value of land and additions on the property. | Land | Improvement |
|---|---|---|---|---|
| 2024 | $1,268 | $40,200 | $10,800 | $29,400 |
| 2023 | $1,268 | $40,200 | $10,800 | $29,400 |
| 2022 | $943 | $28,030 | $7,710 | $20,320 |
| 2021 | $956 | $28,030 | $7,710 | $20,320 |
| 2020 | $915 | $28,030 | $7,710 | $20,320 |
| 2019 | $853 | $25,660 | $5,690 | $19,970 |
| 2018 | $856 | $25,660 | $5,690 | $19,970 |
| 2017 | $798 | $25,660 | $5,690 | $19,970 |
| 2016 | $799 | $24,250 | $5,690 | $18,560 |
| 2015 | $1,253 | $24,250 | $5,690 | $18,560 |
| 2014 | $1,199 | $24,250 | $5,690 | $18,560 |
Source: Public Records
Map
Nearby Homes
- 1351 Omard Dr
- 343 Sheelin Rd
- 912 Omard Dr
- 883 Omard Dr
- 509 Antrim Rd
- 1391 June Dr
- 1283 June Dr
- 1233 June Dr
- 1223 June Dr
- 1342 Kylemore Dr
- 613 N West St
- Harmony Plan at Grandstone Trace
- Newcastle Plan at Grandstone Trace
- Pendleton Plan at Grandstone Trace
- Bellamy Plan at Grandstone Trace
- Chatham Plan at Grandstone Trace
- 523 Hollywood Blvd
- 532 Hollywood Blvd
- 517 Hollywood Blvd
- 1796 Palmer Ct
- 1255 Bingham Dr
- 767 Richard Dr
- 779 Richard Dr
- 1202 Berwald Dr
- 1214 Berwald Dr
- 1190 Berwald Dr
- 793 Richard Dr
- 1265 Bingham Dr
- 1226 Berwald Dr
- 737 Richard Dr
- 1178 Berwald Dr
- 805 Richard Dr
- 1279 Bingham Dr
- 1270 Bingham Dr
- 1240 Berwald Dr
- 723 Richard Dr
- 1168 Berwald Dr
- 817 Richard Dr
- 766 Richard Dr
- 778 Richard Dr