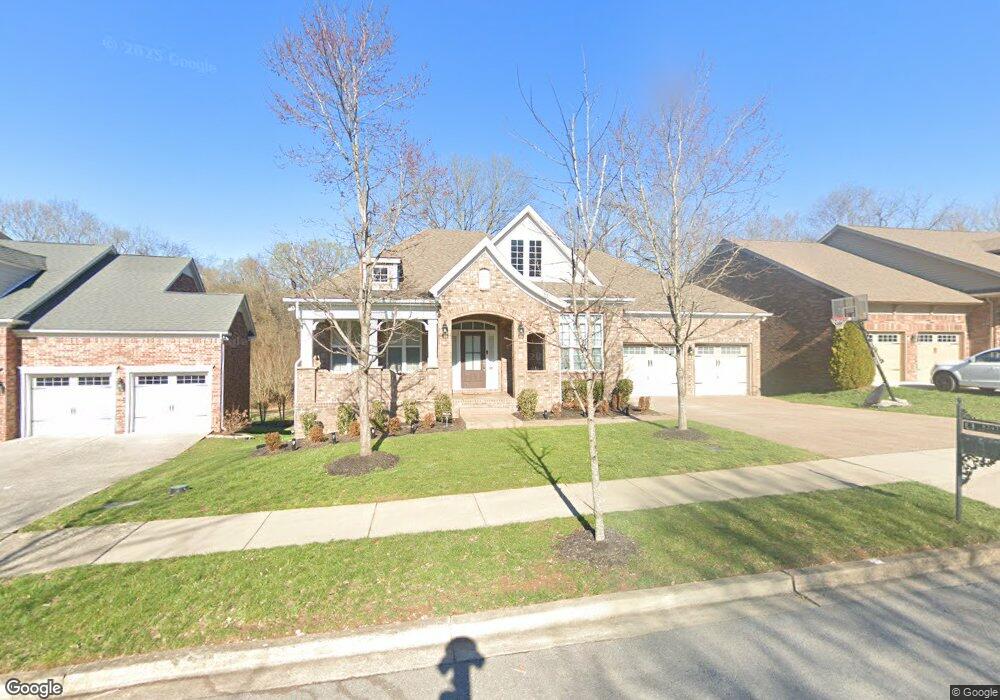
1247 Broadgate Dr Franklin, TN 37067
Estimated Value: $881,000 - $1,065,000
4
Beds
4
Baths
4,965
Sq Ft
$191/Sq Ft
Est. Value
About This Home
This home is located at 1247 Broadgate Dr, Franklin, TN 37067 and is currently estimated at $950,372, approximately $191 per square foot. 1247 Broadgate Dr is a home located in Williamson County with nearby schools including Clovercroft Elementary School, Fred J. Page Middle School, and Centennial High School.
Ownership History
Date
Name
Owned For
Owner Type
Purchase Details
Closed on
Aug 15, 2014
Sold by
Detweiler Wayne M and Detweiler Susan G
Bought by
Horner Randal L and Horner Lori D
Current Estimated Value
Home Financials for this Owner
Home Financials are based on the most recent Mortgage that was taken out on this home.
Original Mortgage
$388,000
Outstanding Balance
$293,277
Interest Rate
4.19%
Mortgage Type
New Conventional
Estimated Equity
$657,095
Purchase Details
Closed on
Sep 10, 2010
Sold by
The Jones Company Of Tennessee Llc
Bought by
Detweiler Wayne M and Detweiler Susan G
Home Financials for this Owner
Home Financials are based on the most recent Mortgage that was taken out on this home.
Original Mortgage
$385,752
Interest Rate
4.6%
Mortgage Type
New Conventional
Create a Home Valuation Report for This Property
The Home Valuation Report is an in-depth analysis detailing your home's value as well as a comparison with similar homes in the area
Purchase History
| Date | Buyer | Sale Price | Title Company |
|---|---|---|---|
| Horner Randal L | $490,000 | Solomon Parks Title & Escrow | |
| Detweiler Wayne M | $482,190 | Southland Title & Escrow Co |
Source: Public Records
Mortgage History
| Date | Status | Borrower | Loan Amount |
|---|---|---|---|
| Open | Horner Randal L | $388,000 | |
| Previous Owner | Detweiler Wayne M | $385,752 |
Source: Public Records
Tax History
| Year | Tax Paid | Tax Assessment Tax Assessment Total Assessment is a certain percentage of the fair market value that is determined by local assessors to be the total taxable value of land and additions on the property. | Land | Improvement |
|---|---|---|---|---|
| 2025 | $3,580 | $222,825 | $48,750 | $174,075 |
| 2024 | $3,580 | $166,050 | $25,000 | $141,050 |
| 2023 | $3,580 | $166,050 | $25,000 | $141,050 |
| 2022 | $3,580 | $166,050 | $25,000 | $141,050 |
| 2021 | $3,580 | $166,050 | $25,000 | $141,050 |
| 2020 | $3,340 | $129,575 | $21,250 | $108,325 |
| 2019 | $3,340 | $129,575 | $21,250 | $108,325 |
| 2018 | $3,249 | $129,575 | $21,250 | $108,325 |
| 2017 | $3,223 | $129,575 | $21,250 | $108,325 |
| 2016 | $3,184 | $129,575 | $21,250 | $108,325 |
| 2015 | -- | $109,175 | $18,750 | $90,425 |
| 2014 | -- | $109,175 | $18,750 | $90,425 |
Source: Public Records
Map
Nearby Homes
- 1815 Charleston Ln
- 1728 Liberty Pike
- 513 King Richards Ct
- 1227 Habersham Way
- 4092 Clovercroft Rd
- 1126 Amelia Park Dr
- 1607 Sand Dollar Ct
- 1820 Lanceford Ct
- 467 Canterbury Rise
- 5055 Poplar Farms Dr
- 137 Banff Ct
- 143 Banff Ct
- 149 Banff Ct
- 131 Banff Ct
- 1006 Poplar Farms Dr
- 1013 Nolencrest Way
- 159 Pennystone Cir
- 2036 Poplar Farms Dr
- 2042 Poplar Farms Dr
- 2007 Poplar Farms Dr
- 1249 Broadgate Dr
- 1245 Broadgate Dr
- 1301 Bantry Ct
- 1243 Broadgate Dr
- 1242 Broadgate Dr
- 1241 Broadgate Dr
- 1305 Bantry Ct
- 1238 Broadgate Dr
- 1425 Chantilly Ln
- 1306 Bantry Ct
- 1428 Chantilly Ln
- 1302 Bantry Ct
- 1239 Broadgate Dr
- 1236 Broadgate Dr
- 1423 Chantilly Ln
- 1426 Chantilly Ln
- 1216 Broadmoor Cir
- 1214 Broadmoor Cir
- 1237 Broadgate Dr
- 1424 Chantilly Ln
Your Personal Tour Guide
Ask me questions while you tour the home.