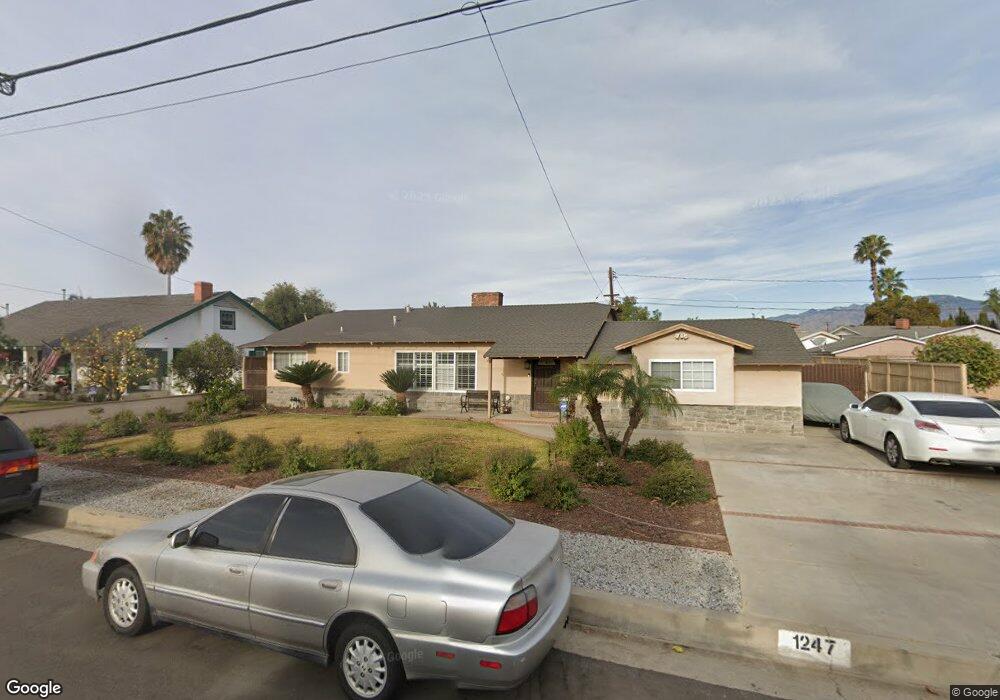
1247 S Willow Ave West Covina, CA 91790
Estimated Value: $840,376 - $1,046,000
3
Beds
2
Baths
1,777
Sq Ft
$515/Sq Ft
Est. Value
About This Home
This home is located at 1247 S Willow Ave, West Covina, CA 91790 and is currently estimated at $914,344, approximately $514 per square foot. 1247 S Willow Ave is a home located in Los Angeles County with nearby schools including Orangewood Elementary School, Edgewood Middle School, and Edgewood High School.
Ownership History
Date
Name
Owned For
Owner Type
Purchase Details
Closed on
Sep 20, 2017
Sold by
Caicedo George F
Bought by
Caicedo George F and Caicedo Diana
Current Estimated Value
Purchase Details
Closed on
Apr 18, 2017
Sold by
Caicedo George F
Bought by
Caicedo George F and Caicedo Diana
Home Financials for this Owner
Home Financials are based on the most recent Mortgage that was taken out on this home.
Original Mortgage
$268,570
Outstanding Balance
$221,505
Interest Rate
3.89%
Mortgage Type
New Conventional
Estimated Equity
$692,839
Purchase Details
Closed on
Mar 4, 1999
Sold by
Alvarez Gilbert M
Bought by
Caicedo George and Caicedo Diane
Home Financials for this Owner
Home Financials are based on the most recent Mortgage that was taken out on this home.
Original Mortgage
$182,844
Interest Rate
7.1%
Mortgage Type
FHA
Create a Home Valuation Report for This Property
The Home Valuation Report is an in-depth analysis detailing your home's value as well as a comparison with similar homes in the area
Home Values in the Area
Average Home Value in this Area
Purchase History
| Date | Buyer | Sale Price | Title Company |
|---|---|---|---|
| Caicedo George F | -- | None Available | |
| Caicedo George F | -- | None Available | |
| Caicedo George F | -- | None Available | |
| Caicedo George F | -- | None Available | |
| Caicedo George | $185,000 | Old Republic Title Company |
Source: Public Records
Mortgage History
| Date | Status | Borrower | Loan Amount |
|---|---|---|---|
| Open | Caicedo George F | $268,570 | |
| Previous Owner | Caicedo George | $182,844 |
Source: Public Records
Tax History Compared to Growth
Tax History
| Year | Tax Paid | Tax Assessment Tax Assessment Total Assessment is a certain percentage of the fair market value that is determined by local assessors to be the total taxable value of land and additions on the property. | Land | Improvement |
|---|---|---|---|---|
| 2025 | $3,856 | $290,004 | $128,697 | $161,307 |
| 2024 | $3,856 | $284,319 | $126,174 | $158,145 |
| 2023 | $3,675 | $278,745 | $123,700 | $155,045 |
| 2022 | $3,698 | $273,280 | $121,275 | $152,005 |
| 2021 | $3,593 | $267,923 | $118,898 | $149,025 |
| 2019 | $3,496 | $259,977 | $115,372 | $144,605 |
| 2018 | $3,271 | $254,880 | $113,110 | $141,770 |
| 2016 | $2,980 | $244,985 | $108,719 | $136,266 |
| 2015 | $2,924 | $241,306 | $107,086 | $134,220 |
| 2014 | $2,911 | $236,580 | $104,989 | $131,591 |
Source: Public Records
Map
Nearby Homes
- 1240 S Bromley Ave
- 1244 S Leland Ave
- 2223 W Mossberg Ave
- 1123 S Sunkist Ave
- 1842 W Merced Ave
- 1820 W Merced Ave
- 1828 W Merced Ave
- 1822 W Merced Ave
- 1818 W Merced Ave
- 1856 W Merced Ave
- Plan 2 at The Grove at Merced
- Plan 1 at The Grove at Merced
- 14321 Walnut Creek Pkwy
- 1816 W Yarnell St
- 1801 W Mossberg Ave
- 1718 Puente Ave Unit 40
- 1735 Puente Ave Unit 30
- 1911 W Doublegrove St
- 3448 Ardilla Ave
- 14360 Merced Ave
- 1241 S Willow Ave
- 1307 S Willow Ave
- 1300 S Bromley Ave
- 1306 S Bromley Ave
- 1244 S Bromley Ave
- 1235 S Willow Ave
- 1310 S Bromley Ave
- 1233 S Willow Ave
- 1244 S Willow Ave
- 1304 S Willow Ave
- 1236 S Willow Ave
- 2202 W Ituni St
- 2208 W Ituni St
- 1229 S Willow Ave
- 1305 S Bromley Ave
- 1314 S Willow Ave
- 1234 S Willow Ave
- 1301 S Bromley Ave
- 1241 S Bromley Ave
- 2214 W Ituni St