Estimated Value: $307,000 - $320,182
Studio
--
Bath
1,560
Sq Ft
$199/Sq Ft
Est. Value
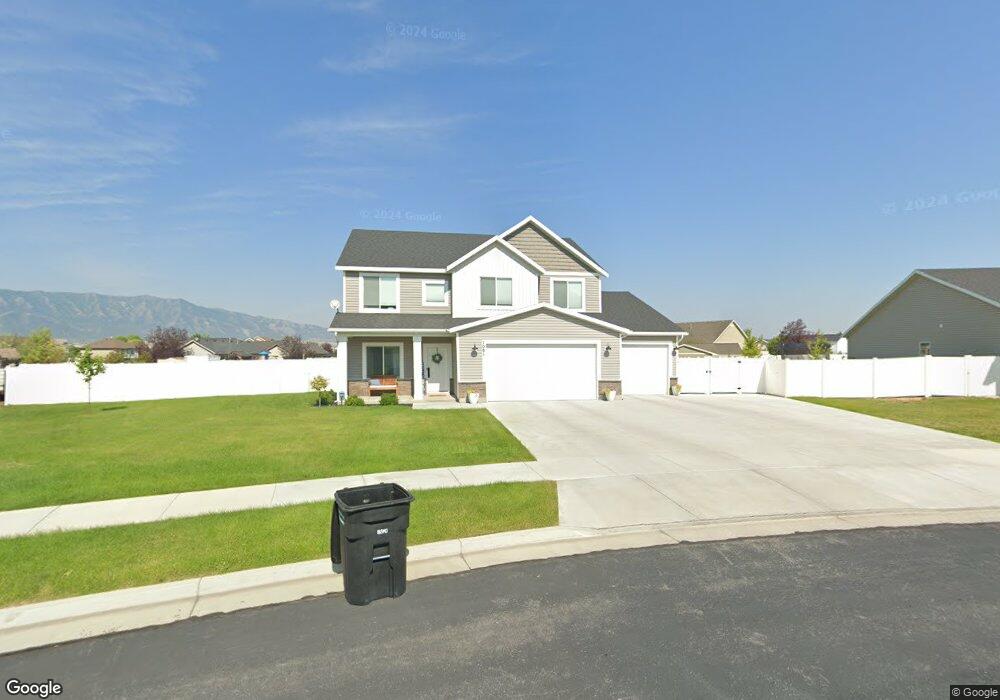
About This Home
This home is located at 1247 W 2350 S, Logan, UT 84321 and is currently estimated at $310,796, approximately $199 per square foot. 1247 W 2350 S is a home with nearby schools including Nibley School, Spring Creek Middle School, and South Cache Middle School.
Ownership History
Date
Name
Owned For
Owner Type
Purchase Details
Closed on
Apr 6, 2021
Sold by
Mohr Harvey
Bought by
Mohr Jakob and Mohr Kevin H
Current Estimated Value
Home Financials for this Owner
Home Financials are based on the most recent Mortgage that was taken out on this home.
Original Mortgage
$247,000
Outstanding Balance
$221,294
Interest Rate
2.8%
Mortgage Type
New Conventional
Estimated Equity
$89,502
Purchase Details
Closed on
Jan 22, 2021
Sold by
Thornley Mindy Marie and Thornley Kathy
Bought by
Mohr Harvey
Purchase Details
Closed on
Feb 22, 2016
Sold by
Christensen Robert D and Christensen Claudia G
Bought by
Thornley Mindy Marie and Thornley Kathy
Purchase Details
Closed on
Jul 15, 2009
Sold by
Christensen Jason and Christensen Brittany
Bought by
Christensen Robert D and Christensen Claudia G
Purchase Details
Closed on
Nov 21, 2008
Sold by
Spring Creek Crossing Inc
Bought by
Christensen Jason and Christensen Brittany
Create a Home Valuation Report for This Property
The Home Valuation Report is an in-depth analysis detailing your home's value as well as a comparison with similar homes in the area
Home Values in the Area
Average Home Value in this Area
Purchase History
| Date | Buyer | Sale Price | Title Company |
|---|---|---|---|
| Mohr Jakob | -- | Cache Title Logan | |
| Mohr Harvey | -- | Cache Title Logan | |
| Thornley Mindy Marie | -- | Cache Title Logan | |
| Christensen Robert D | -- | Accommodation | |
| Christensen Jason | -- | Cache Title Company |
Source: Public Records
Mortgage History
| Date | Status | Borrower | Loan Amount |
|---|---|---|---|
| Open | Mohr Jakob | $247,000 |
Source: Public Records
Tax History
| Year | Tax Paid | Tax Assessment Tax Assessment Total Assessment is a certain percentage of the fair market value that is determined by local assessors to be the total taxable value of land and additions on the property. | Land | Improvement |
|---|---|---|---|---|
| 2025 | $1,356 | $179,680 | $0 | $0 |
| 2024 | $1,553 | $193,260 | $0 | $0 |
| 2023 | $1,555 | $181,225 | $0 | $0 |
| 2022 | $162 | $181,225 | $0 | $0 |
| 2021 | $1,324 | $230,282 | $40,000 | $190,282 |
| 2020 | $1,241 | $205,463 | $40,000 | $165,463 |
| 2019 | $1,302 | $205,463 | $40,000 | $165,463 |
| 2018 | $1,128 | $173,735 | $26,000 | $147,735 |
| 2017 | $1,124 | $91,685 | $0 | $0 |
| 2016 | $1,137 | $78,200 | $0 | $0 |
| 2015 | $963 | $78,200 | $0 | $0 |
| 2014 | $933 | $78,200 | $0 | $0 |
| 2013 | $927 | $79,740 | $0 | $0 |
Source: Public Records
Map
Nearby Homes
- 1250 W 2420 S
- 2238 S 1120 W Unit 68
- 1045 W 2400 S
- 1430 W 2200 S
- 2174 S 1450 W
- 2313 S 1000 W Unit 110
- 2313 S 1000 W
- 3308 S 1000 W
- 2124 S 1490 W
- 1532 W 2150 S
- 2225 S 1600 W
- 1145 W 2000 S
- 2771 S 1150 W
- 1975 S 1100 W
- 2770 S 1070 West Sunset Park
- 2011 Wren Cir
- 879 W 2200 S Unit 153
- 879 W 2200 S Unit 155
- 879 W 2200 S Unit 152
- 879 W 2200 S Unit 156
Your Personal Tour Guide
Ask me questions while you tour the home.