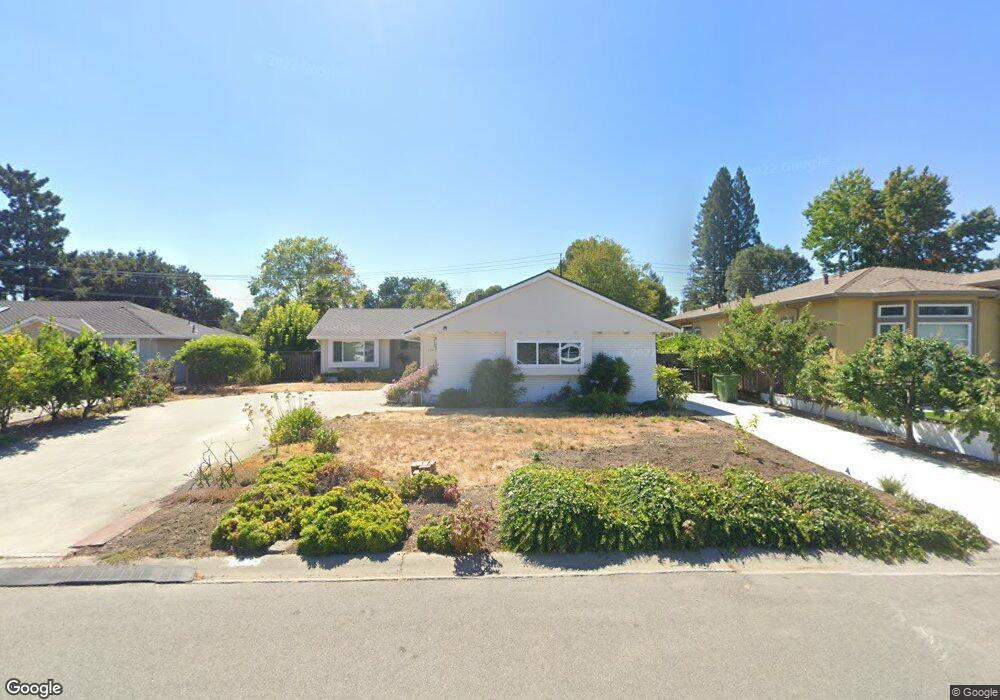
12470 Palmtag Dr Saratoga, CA 95070
West San Jose NeighborhoodEstimated Value: $3,222,000 - $3,602,000
3
Beds
2
Baths
1,783
Sq Ft
$1,876/Sq Ft
Est. Value
About This Home
This home is located at 12470 Palmtag Dr, Saratoga, CA 95070 and is currently estimated at $3,345,778, approximately $1,876 per square foot. 12470 Palmtag Dr is a home located in Santa Clara County with nearby schools including Blue Hills Elementary School, Joaquin Miller Middle, and Lynbrook High School.
Ownership History
Date
Name
Owned For
Owner Type
Purchase Details
Closed on
May 10, 2021
Sold by
Wang Youlong Frank and Cen Shelly Xiaoli
Bought by
Wang Youlong Frank and Cen Siielly Xiaoli
Current Estimated Value
Purchase Details
Closed on
Jul 26, 2019
Sold by
Wang Youlong F and Cen Shelly Xiaoli
Bought by
Wang Youlong F and Cen Shelly Xiaoli
Home Financials for this Owner
Home Financials are based on the most recent Mortgage that was taken out on this home.
Original Mortgage
$445,000
Outstanding Balance
$390,536
Interest Rate
3.8%
Mortgage Type
New Conventional
Estimated Equity
$2,955,242
Purchase Details
Closed on
Jan 6, 2004
Sold by
Sobol Mervin and Sobol Shirley J
Bought by
Wang Youlong Frank and Cen Shelly Xiaoli
Home Financials for this Owner
Home Financials are based on the most recent Mortgage that was taken out on this home.
Original Mortgage
$600,000
Interest Rate
4.37%
Mortgage Type
Purchase Money Mortgage
Purchase Details
Closed on
Nov 13, 2001
Sold by
Sobol Mervin and Sobol Shirley J
Bought by
Sobol Mervin and Sobol Shirley J
Create a Home Valuation Report for This Property
The Home Valuation Report is an in-depth analysis detailing your home's value as well as a comparison with similar homes in the area
Home Values in the Area
Average Home Value in this Area
Purchase History
| Date | Buyer | Sale Price | Title Company |
|---|---|---|---|
| Wang Youlong Frank | -- | None Available | |
| Wang Youlong F | -- | Wfg National Title Ins Co | |
| Wang Youlong Frank | $925,000 | Financial Title Company | |
| Sobol Mervin | -- | -- |
Source: Public Records
Mortgage History
| Date | Status | Borrower | Loan Amount |
|---|---|---|---|
| Open | Wang Youlong F | $445,000 | |
| Closed | Wang Youlong Frank | $600,000 |
Source: Public Records
Tax History Compared to Growth
Tax History
| Year | Tax Paid | Tax Assessment Tax Assessment Total Assessment is a certain percentage of the fair market value that is determined by local assessors to be the total taxable value of land and additions on the property. | Land | Improvement |
|---|---|---|---|---|
| 2025 | $15,875 | $1,315,140 | $1,117,806 | $197,334 |
| 2024 | $15,875 | $1,289,354 | $1,095,889 | $193,465 |
| 2023 | $15,758 | $1,264,073 | $1,074,401 | $189,672 |
| 2022 | $15,778 | $1,239,288 | $1,053,335 | $185,953 |
| 2021 | $15,516 | $1,214,989 | $1,032,682 | $182,307 |
| 2020 | $15,314 | $1,202,532 | $1,022,094 | $180,438 |
| 2019 | $14,946 | $1,178,953 | $1,002,053 | $176,900 |
| 2018 | $14,591 | $1,155,837 | $982,405 | $173,432 |
| 2017 | $14,568 | $1,133,175 | $963,143 | $170,032 |
| 2016 | $13,974 | $1,110,957 | $944,258 | $166,699 |
| 2015 | $13,862 | $1,094,271 | $930,075 | $164,196 |
| 2014 | $13,498 | $1,072,837 | $911,857 | $160,980 |
Source: Public Records
Map
Nearby Homes
- 12140 Woodside Dr
- 19423 Vineyard Ln
- 12584 Paseo Flores
- 11010 Maple Place Unit 25-06 Plan 4
- 10750 Elm Cir Unit 88-17 Plan 2
- 11315 Cottonwood Place Unit 39-09 Plan 3
- 10730 Elm Cir Unit 86-17 Plan 2
- Plan 2 at The Elms
- Plan 3 at The Elms
- Plan 4 at The Elms
- 19113 Vineyard Ln
- 11210 Cottonwood Place Unit 35-08 Plan 4
- 11645 Redwood Place Unit 56-12 Plan 4
- 11220 Cottonwood Place Unit 36-08 Plan 2
- 11240 Cottonwood Place Unit 38-08 Plan 3
- 11115 Maple Place Unit 30-07
- 11125 Maple Place Unit 31-07 Plan 2
- 11145 Maple Place Unit 33-07 Plan 2
- 11155 Maple Place Unit 34-07 Plan 3
- 11040 Maple Place Unit 28-06 Plan 2
- 12480 Palmtag Dr
- 12460 Palmtag Dr
- 12481 Brookglen Dr
- 12469 Brookglen Dr
- 12490 Palmtag Dr
- 12446 Palmtag Dr
- 12493 Brookglen Dr
- 12465 Palmtag Dr
- 12449 Palmtag Dr
- 12479 Palmtag Dr
- 12500 Palmtag Dr
- 12433 Palmtag Dr
- 12505 Brookglen Dr
- 12445 Brookglen Dr
- 12432 Palmtag Dr
- 12455 Brookglen Dr
- 12491 Palmtag Dr
- 12417 Palmtag Dr
- 12433 Brookglen Dr
- 12510 Palmtag Dr