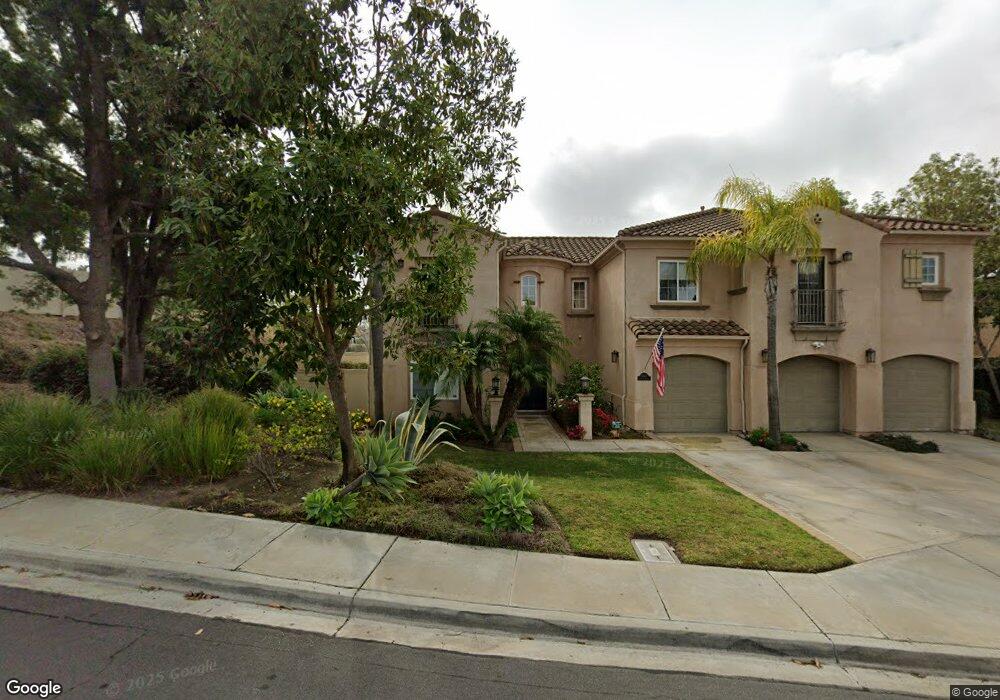
12471 Figtree St San Diego, CA 92131
Scripps Ranch NeighborhoodEstimated Value: $2,191,009 - $2,787,000
5
Beds
5
Baths
3,952
Sq Ft
$638/Sq Ft
Est. Value
About This Home
This home is located at 12471 Figtree St, San Diego, CA 92131 and is currently estimated at $2,523,252, approximately $638 per square foot. 12471 Figtree St is a home located in San Diego County with nearby schools including Jerabek Elementary School, Thurgood Marshall Middle School, and Scripps Ranch High School.
Ownership History
Date
Name
Owned For
Owner Type
Purchase Details
Closed on
Nov 16, 2012
Sold by
Couch Damon R and Couch Susan K
Bought by
Couch Damon R and Couch Susan K
Current Estimated Value
Home Financials for this Owner
Home Financials are based on the most recent Mortgage that was taken out on this home.
Original Mortgage
$706,000
Outstanding Balance
$472,839
Interest Rate
2.75%
Mortgage Type
New Conventional
Estimated Equity
$2,050,413
Purchase Details
Closed on
Mar 25, 1999
Sold by
Madera Spring Canyon Associates Lp
Bought by
Couch Damon R and Couch Susan K
Home Financials for this Owner
Home Financials are based on the most recent Mortgage that was taken out on this home.
Original Mortgage
$479,925
Interest Rate
6.87%
Create a Home Valuation Report for This Property
The Home Valuation Report is an in-depth analysis detailing your home's value as well as a comparison with similar homes in the area
Home Values in the Area
Average Home Value in this Area
Purchase History
| Date | Buyer | Sale Price | Title Company |
|---|---|---|---|
| Couch Damon R | -- | Chicago Title Company | |
| Couch Damon R | -- | Chicago Title Company | |
| Couch Damon R | $600,000 | Chicago Title |
Source: Public Records
Mortgage History
| Date | Status | Borrower | Loan Amount |
|---|---|---|---|
| Open | Couch Damon R | $706,000 | |
| Closed | Couch Damon R | $479,925 |
Source: Public Records
Tax History Compared to Growth
Tax History
| Year | Tax Paid | Tax Assessment Tax Assessment Total Assessment is a certain percentage of the fair market value that is determined by local assessors to be the total taxable value of land and additions on the property. | Land | Improvement |
|---|---|---|---|---|
| 2025 | $11,433 | $940,454 | $274,342 | $666,112 |
| 2024 | $11,433 | $922,014 | $268,963 | $653,051 |
| 2023 | $11,175 | $903,937 | $263,690 | $640,247 |
| 2022 | $10,870 | $886,214 | $258,520 | $627,694 |
| 2021 | $10,787 | $868,838 | $253,451 | $615,387 |
| 2020 | $10,655 | $859,930 | $250,853 | $609,077 |
| 2019 | $10,463 | $843,070 | $245,935 | $597,135 |
| 2018 | $9,784 | $826,540 | $241,113 | $585,427 |
| 2017 | $9,550 | $810,335 | $236,386 | $573,949 |
| 2016 | $9,396 | $794,447 | $231,751 | $562,696 |
| 2015 | $9,255 | $782,514 | $228,270 | $554,244 |
| 2014 | $9,108 | $767,187 | $223,799 | $543,388 |
Source: Public Records
Map
Nearby Homes
- 10878 Caminito Colorado
- 11393 Vista Elevada
- 10976 Caminito Alto
- 10494 Livewood Way
- 10905 Elderwood Rd
- 12026 Medoc Ln
- 10154 Pinecastle St
- 11313 Wild Meadow Place
- 12676 Legacy Rd
- 12565 Fairbrook Rd
- 12061 Rue Des Amis
- 10460 La Vita Ct
- 11837 La Colina Rd
- 11770 Fantasia Ct
- 11810 Evergold St
- 10405 White Birch Dr
- 10616 Falcon Rim Point
- 9970 Mesa Madera Dr
- 11380 Ironwood Rd
- 14190 Green Valley Ct
- 12467 Figtree St
- 12485 Figtree St
- 12472 Figtree St
- 12468 Figtree St
- 12453 Figtree St
- 12484 Figtree St
- 12454 Figtree St
- 12495 Figtree St
- 10808 Birch Bluff Ave
- 12445 Figtree St
- 10794 Edenoaks St
- 10788 Edenoaks St
- 10786 Birch Bluff Ave
- 10772 Edenoaks St
- 10818 Birch Bluff Ave
- 12430 Figtree St
- 12431 Figtree St
- 10766 Birch Bluff Ave
- 10776 Birch Bluff Ave
- 10760 Edenoaks St