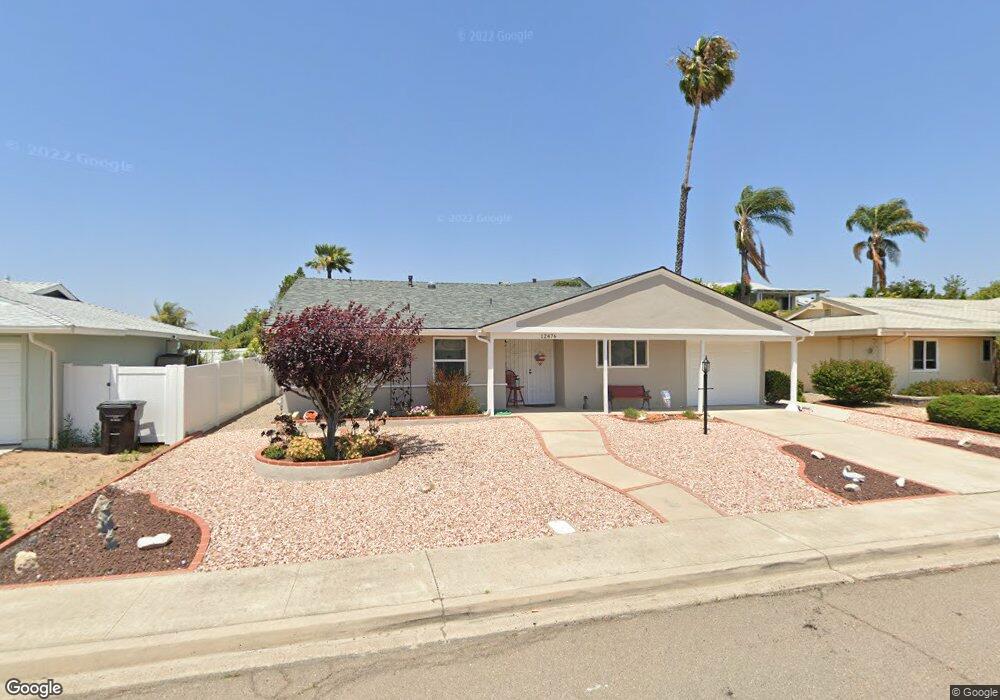
12476 Mantilla Rd San Diego, CA 92128
Rancho Bernardo NeighborhoodEstimated Value: $723,000 - $900,000
2
Beds
2
Baths
1,197
Sq Ft
$679/Sq Ft
Est. Value
About This Home
This home is located at 12476 Mantilla Rd, San Diego, CA 92128 and is currently estimated at $812,832, approximately $679 per square foot. 12476 Mantilla Rd is a home located in San Diego County with nearby schools including Highland Ranch Elementary School, Bernardo Heights Middle, and Rancho Bernardo High.
Ownership History
Date
Name
Owned For
Owner Type
Purchase Details
Closed on
Dec 6, 2010
Sold by
Solstad Gloria J
Bought by
Solstad Gloria J
Current Estimated Value
Purchase Details
Closed on
Oct 5, 2010
Sold by
Solstad Gloria J
Bought by
Solstad Gloria J
Purchase Details
Closed on
Nov 13, 2007
Sold by
Solstad Gloria J
Bought by
Gloria J Solstad Revocable Living Trust
Purchase Details
Closed on
Nov 22, 2006
Sold by
Schauder Joan B and Wolff Louis D
Bought by
Solstad Gloria J
Home Financials for this Owner
Home Financials are based on the most recent Mortgage that was taken out on this home.
Original Mortgage
$70,000
Interest Rate
6.09%
Mortgage Type
Purchase Money Mortgage
Purchase Details
Closed on
Jul 24, 2006
Sold by
Solstad Gloria J
Bought by
Solstad Gloria J
Purchase Details
Closed on
May 19, 2004
Sold by
Wolff Louis D
Bought by
Wolff Sophie
Purchase Details
Closed on
Dec 27, 1991
Purchase Details
Closed on
Dec 2, 1987
Create a Home Valuation Report for This Property
The Home Valuation Report is an in-depth analysis detailing your home's value as well as a comparison with similar homes in the area
Home Values in the Area
Average Home Value in this Area
Purchase History
| Date | Buyer | Sale Price | Title Company |
|---|---|---|---|
| Solstad Gloria J | -- | None Available | |
| Solstad Gloria J | -- | None Available | |
| Gloria J Solstad Revocable Living Trust | -- | None Available | |
| Solstad Gloria J | $365,000 | Southland Title Of San Diego | |
| Solstad Gloria J | -- | Lawyers Title Co | |
| Wolff Sophie | -- | -- | |
| Wolff Sophie | -- | -- | |
| Wolff Sophie | -- | -- | |
| -- | $131,500 | -- | |
| -- | $100,000 | -- |
Source: Public Records
Mortgage History
| Date | Status | Borrower | Loan Amount |
|---|---|---|---|
| Previous Owner | Solstad Gloria J | $70,000 |
Source: Public Records
Tax History Compared to Growth
Tax History
| Year | Tax Paid | Tax Assessment Tax Assessment Total Assessment is a certain percentage of the fair market value that is determined by local assessors to be the total taxable value of land and additions on the property. | Land | Improvement |
|---|---|---|---|---|
| 2025 | $3,009 | $274,630 | $111,632 | $162,998 |
| 2024 | $3,009 | $269,246 | $109,444 | $159,802 |
| 2023 | $2,943 | $263,968 | $107,299 | $156,669 |
| 2022 | $2,893 | $258,794 | $105,196 | $153,598 |
| 2021 | $2,854 | $253,721 | $103,134 | $150,587 |
| 2020 | $2,815 | $251,120 | $102,077 | $149,043 |
| 2019 | $2,742 | $246,197 | $100,076 | $146,121 |
| 2018 | $2,664 | $241,370 | $98,114 | $143,256 |
| 2017 | $83 | $236,639 | $96,191 | $140,448 |
| 2016 | $2,537 | $232,000 | $94,305 | $137,695 |
| 2015 | $2,499 | $228,516 | $92,889 | $135,627 |
| 2014 | $2,440 | $224,041 | $91,070 | $132,971 |
Source: Public Records
Map
Nearby Homes
- 12486 Lomica Dr
- 12494 Senda Rd
- 16422 Roca Dr
- 16413 Roca Dr
- 12365 Horado Rd
- 16498 Roca Dr
- 16182 Selva Dr
- 16515 Felice Dr
- 12249 Horado Rd
- 16407 Caminito Vecinos Unit 155
- 12753 Caminito Cancion Unit 129
- 12821 Avenida la Valencia
- 16556 Gabarda Rd
- 16421 Ramada Dr
- 12424 Rios Rd
- 12257 Avenida Consentido
- 16632 Roca Dr Unit 41
- 16566 Caminito Vecinos Unit 31
- 16555 Caminito Vecinos Unit 39
- 16599 Caminito Vecinos Unit 5
- 12464 Mantilla Rd
- 12549 Niego Ln
- 16321 Sarape Dr
- 12452 Mantilla Rd
- 12502 Mantilla Rd
- 12557 Niego Ln
- 12541 Niego Ln
- 12475 Mantilla Rd
- 16331 Sarape Dr
- 12487 Mantilla Rd Unit 6
- 12463 Mantilla Rd
- 12565 Niego Ln
- 12512 Mantilla Rd Unit 6
- 12503 Mantilla Rd
- 12451 Mantilla Rd
- 12533 Niego Ln
- 16341 Sarape Dr
- 12513 Mantilla Rd
- 12438 Mantilla Rd
- 12548 Niego Ln