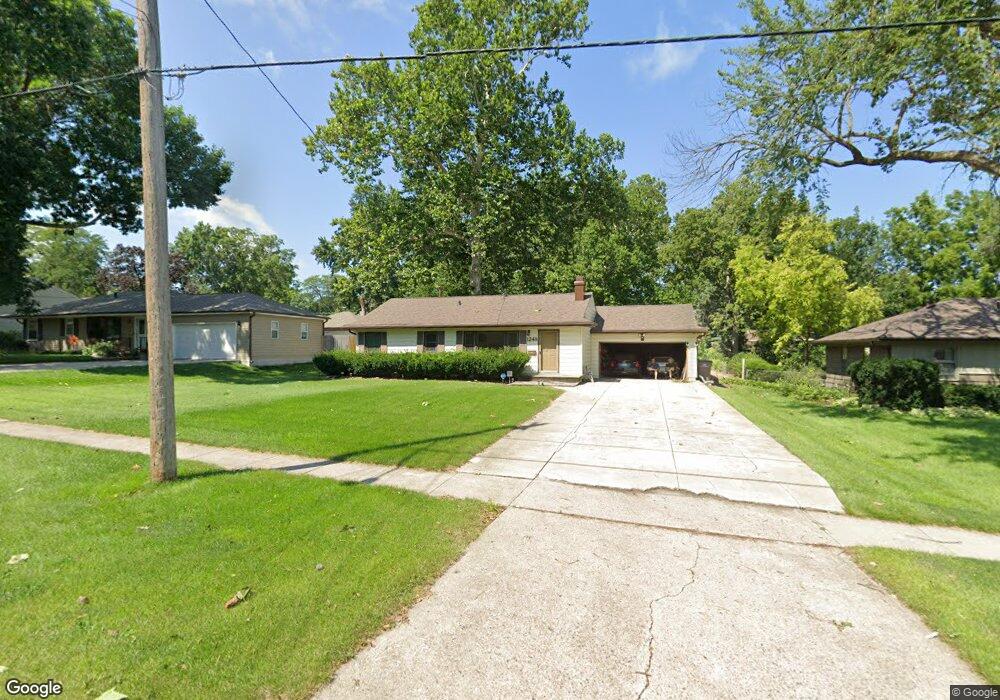
1248 17th St West Des Moines, IA 50265
Estimated Value: $260,000 - $278,000
3
Beds
2
Baths
1,056
Sq Ft
$256/Sq Ft
Est. Value
About This Home
This home is located at 1248 17th St, West Des Moines, IA 50265 and is currently estimated at $269,892, approximately $255 per square foot. 1248 17th St is a home located in Polk County with nearby schools including Hillside Elementary School, Stilwell Junior High School, and Valley Southwoods Freshman High School.
Ownership History
Date
Name
Owned For
Owner Type
Purchase Details
Closed on
Mar 15, 2002
Sold by
Commercial Federal Bank
Bought by
Givant David J
Current Estimated Value
Home Financials for this Owner
Home Financials are based on the most recent Mortgage that was taken out on this home.
Original Mortgage
$73,500
Outstanding Balance
$30,811
Interest Rate
7.11%
Estimated Equity
$239,081
Purchase Details
Closed on
Jan 31, 2002
Sold by
Nesbit Mark S and Nesbit Molly J
Bought by
Commercial Federal Bank
Home Financials for this Owner
Home Financials are based on the most recent Mortgage that was taken out on this home.
Original Mortgage
$73,500
Outstanding Balance
$30,811
Interest Rate
7.11%
Estimated Equity
$239,081
Create a Home Valuation Report for This Property
The Home Valuation Report is an in-depth analysis detailing your home's value as well as a comparison with similar homes in the area
Home Values in the Area
Average Home Value in this Area
Purchase History
| Date | Buyer | Sale Price | Title Company |
|---|---|---|---|
| Givant David J | $113,000 | -- | |
| Commercial Federal Bank | $109,000 | -- |
Source: Public Records
Mortgage History
| Date | Status | Borrower | Loan Amount |
|---|---|---|---|
| Open | Givant David J | $73,500 |
Source: Public Records
Tax History Compared to Growth
Tax History
| Year | Tax Paid | Tax Assessment Tax Assessment Total Assessment is a certain percentage of the fair market value that is determined by local assessors to be the total taxable value of land and additions on the property. | Land | Improvement |
|---|---|---|---|---|
| 2025 | $3,442 | $256,000 | $71,500 | $184,500 |
| 2024 | $3,442 | $227,600 | $62,700 | $164,900 |
| 2023 | $3,388 | $227,600 | $62,700 | $164,900 |
| 2022 | $3,346 | $184,300 | $52,600 | $131,700 |
| 2021 | $3,160 | $184,300 | $52,600 | $131,700 |
| 2020 | $3,108 | $166,200 | $47,300 | $118,900 |
| 2019 | $2,948 | $166,200 | $47,300 | $118,900 |
| 2018 | $2,950 | $152,400 | $42,500 | $109,900 |
| 2017 | $2,850 | $152,400 | $42,500 | $109,900 |
| 2016 | $2,782 | $143,300 | $39,400 | $103,900 |
| 2015 | $2,782 | $143,300 | $39,400 | $103,900 |
| 2014 | $2,634 | $138,800 | $37,500 | $101,300 |
Source: Public Records
Map
Nearby Homes
- 1230 16th St
- 1827 Pleasant St
- 1114 22nd St
- 542 Bella St
- 1625 19th St
- 924 13th St
- 1006 22nd St
- 2408 Pleasant St
- 2100 Meadow Brook Dr Unit 103
- 1705 Buffalo Rd
- 817 Ashmore Cir
- 1909 Prospect Ave
- 800 13th St
- 842 23rd St
- 725 20th St
- 720 19th St
- 3927 Westgate Pkwy
- 4052 NW 175th St
- 3945 Westgate Pkwy
- 3963 Westgate Pkwy