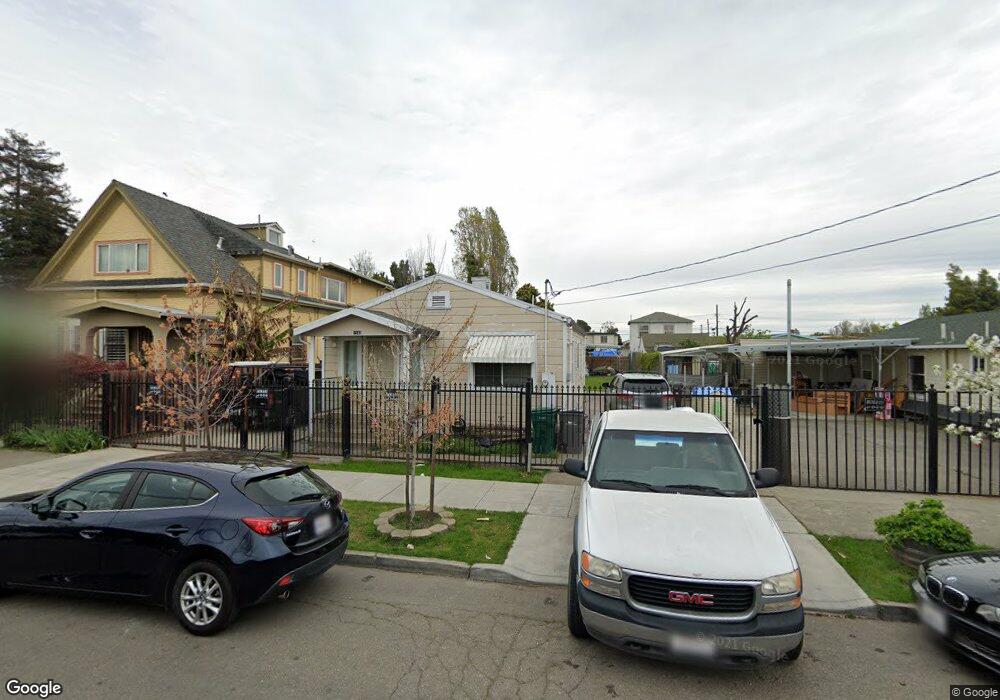
1248 86th Ave Oakland, CA 94621
Highland NeighborhoodEstimated Value: $392,000 - $496,000
2
Beds
1
Bath
864
Sq Ft
$510/Sq Ft
Est. Value
About This Home
This home is located at 1248 86th Ave, Oakland, CA 94621 and is currently estimated at $440,929, approximately $510 per square foot. 1248 86th Ave is a home located in Alameda County with nearby schools including New Highland Academy, Acorn Woodland Elementary School, and Encompass Academy Elementary.
Ownership History
Date
Name
Owned For
Owner Type
Purchase Details
Closed on
Dec 4, 2017
Sold by
Rendon Miguel and Rendon Maria
Bought by
Rendon Miguel and Rendon Maria C
Current Estimated Value
Purchase Details
Closed on
Jun 6, 2011
Sold by
Duenas Octavio and Duenas Blanca
Bought by
Rendon Miguel and Rendon Maria
Purchase Details
Closed on
Jun 15, 1999
Sold by
Haugabook Ronald V
Bought by
Pittman Rose P
Create a Home Valuation Report for This Property
The Home Valuation Report is an in-depth analysis detailing your home's value as well as a comparison with similar homes in the area
Home Values in the Area
Average Home Value in this Area
Purchase History
| Date | Buyer | Sale Price | Title Company |
|---|---|---|---|
| Rendon Miguel | -- | None Available | |
| Rendon Miguel | $80,000 | Chicago Title Company | |
| Pittman Rose P | $87,000 | -- |
Source: Public Records
Tax History
| Year | Tax Paid | Tax Assessment Tax Assessment Total Assessment is a certain percentage of the fair market value that is determined by local assessors to be the total taxable value of land and additions on the property. | Land | Improvement |
|---|---|---|---|---|
| 2025 | $3,631 | $137,527 | $30,746 | $106,781 |
| 2024 | $3,631 | $134,831 | $30,143 | $104,688 |
| 2023 | $3,688 | $132,187 | $29,552 | $102,635 |
| 2022 | $3,522 | $129,596 | $28,973 | $100,623 |
| 2021 | $3,230 | $127,055 | $28,405 | $98,650 |
| 2020 | $3,190 | $125,753 | $28,114 | $97,639 |
| 2019 | $2,983 | $123,288 | $27,563 | $95,725 |
| 2018 | $2,922 | $120,872 | $27,023 | $93,849 |
| 2017 | $2,778 | $118,502 | $26,493 | $92,009 |
| 2016 | $2,602 | $116,180 | $25,974 | $90,206 |
| 2015 | $2,185 | $85,280 | $25,584 | $59,696 |
| 2014 | $2,048 | $83,608 | $25,082 | $58,526 |
Source: Public Records
Map
Nearby Homes
Your Personal Tour Guide
Ask me questions while you tour the home.