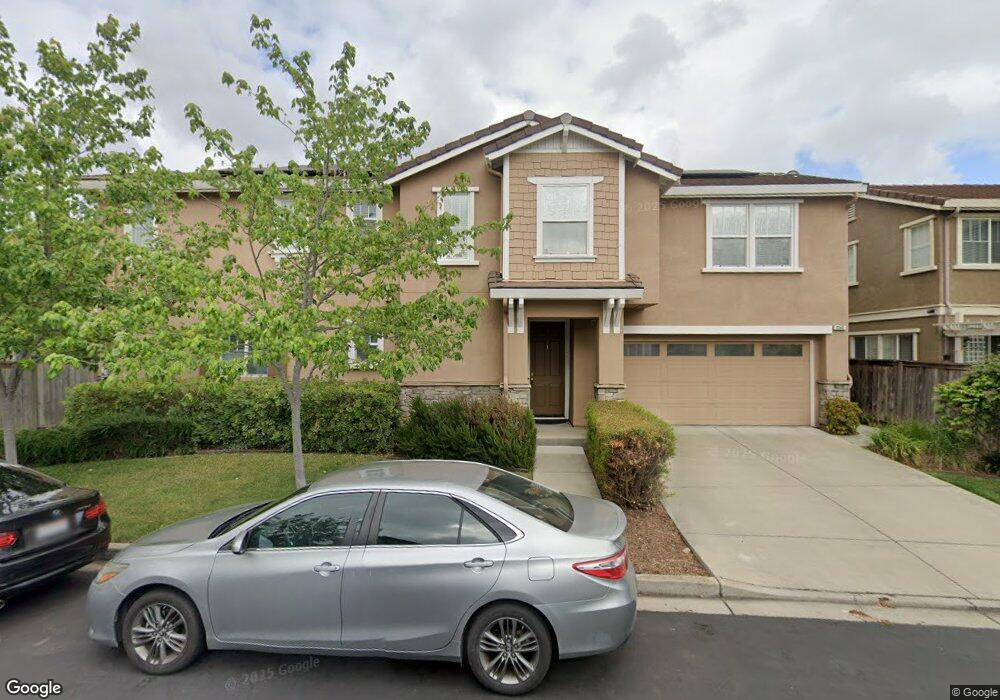
1248 Alder Creek Cir San Leandro, CA 94577
Davis Tract NeighborhoodEstimated Value: $762,000 - $1,084,000
4
Beds
3
Baths
2,026
Sq Ft
$468/Sq Ft
Est. Value
About This Home
This home is located at 1248 Alder Creek Cir, San Leandro, CA 94577 and is currently estimated at $948,313, approximately $468 per square foot. 1248 Alder Creek Cir is a home located in Alameda County with nearby schools including Halkin Elementary School, John Muir Middle School, and San Leandro High School.
Ownership History
Date
Name
Owned For
Owner Type
Purchase Details
Closed on
May 15, 2009
Sold by
Fong Chris B and Fong Myra J
Bought by
Fong Chris B and Fong Myra J
Current Estimated Value
Home Financials for this Owner
Home Financials are based on the most recent Mortgage that was taken out on this home.
Original Mortgage
$391,000
Outstanding Balance
$246,377
Interest Rate
4.8%
Mortgage Type
New Conventional
Estimated Equity
$701,936
Purchase Details
Closed on
Jun 22, 2007
Sold by
Fong Chris B and Fong Myra J
Bought by
Fong Chris B and Fong Myra J
Purchase Details
Closed on
Dec 18, 2002
Sold by
Ryland Homes Of California Inc
Bought by
Fong Chris B and Fong Myra J
Home Financials for this Owner
Home Financials are based on the most recent Mortgage that was taken out on this home.
Original Mortgage
$427,880
Interest Rate
6.03%
Create a Home Valuation Report for This Property
The Home Valuation Report is an in-depth analysis detailing your home's value as well as a comparison with similar homes in the area
Home Values in the Area
Average Home Value in this Area
Purchase History
| Date | Buyer | Sale Price | Title Company |
|---|---|---|---|
| Fong Chris B | -- | Chicago Title Company | |
| Fong Chris B | -- | Chicago Title Company | |
| Fong Chris B | -- | None Available | |
| Fong Chris B | $545,454 | First American Title Guarant |
Source: Public Records
Mortgage History
| Date | Status | Borrower | Loan Amount |
|---|---|---|---|
| Open | Fong Chris B | $391,000 | |
| Closed | Fong Chris B | $427,880 |
Source: Public Records
Tax History Compared to Growth
Tax History
| Year | Tax Paid | Tax Assessment Tax Assessment Total Assessment is a certain percentage of the fair market value that is determined by local assessors to be the total taxable value of land and additions on the property. | Land | Improvement |
|---|---|---|---|---|
| 2025 | $10,124 | $767,497 | $232,436 | $542,061 |
| 2024 | $10,124 | $752,313 | $227,879 | $531,434 |
| 2023 | $10,060 | $744,430 | $223,412 | $521,018 |
| 2022 | $9,779 | $722,835 | $219,032 | $510,803 |
| 2021 | $9,479 | $708,529 | $214,739 | $500,790 |
| 2020 | $9,236 | $708,197 | $212,538 | $495,659 |
| 2019 | $8,962 | $694,314 | $208,372 | $485,942 |
| 2018 | $8,737 | $680,703 | $204,287 | $476,416 |
| 2017 | $8,562 | $667,360 | $200,283 | $467,077 |
| 2016 | $8,113 | $654,279 | $196,357 | $457,922 |
| 2015 | $7,527 | $606,000 | $181,800 | $424,200 |
| 2014 | $6,661 | $525,000 | $157,500 | $367,500 |
Source: Public Records
Map
Nearby Homes
- 1205 Amber Ct
- 784 Douglas Dr
- 11103 Novelda Dr
- 11132 Acalanes Dr
- 10945 Estepa Dr
- 10906 Reposo Dr
- 1145 Camellia Ct
- 528 La Prenda Dr
- 107 Catron Dr
- 131 Accolade Dr
- 11070 San Leandro St
- 620 El Paseo Dr
- 808 Martin Blvd
- 559 Almanza Dr
- 1223 Wainwright Ave
- 527 Capistrano Dr
- 10538 Creekside Cir
- 10580 Creekside Cir
- 365 Lille Ave
- 337 Farrelly Dr
- 1242 Alder Creek Cir
- 1250 Alder Creek Cir
- 1240 Alder Creek Cir
- 1262 Alder Creek Cir
- 1261 Alder Creek Cir
- 1232 Alder Creek Cir
- 1263 Alder Creek Cir
- 1265 Alder Creek Cir
- 1259 Alder Creek Cir
- 1267 Alder Creek Cir
- 1236 Alder Creek Cir
- 1266 Alder Creek Cir
- 1257 Alder Creek Cir
- 1230 Alder Creek Cir
- 1269 Alder Creek Cir
- 1268 Alder Creek Cir
- 1243 Alder Creek Cir
- 1255 Alder Creek Cir
- 1249 Alder Creek Cir
- 1226 Alder Creek Cir