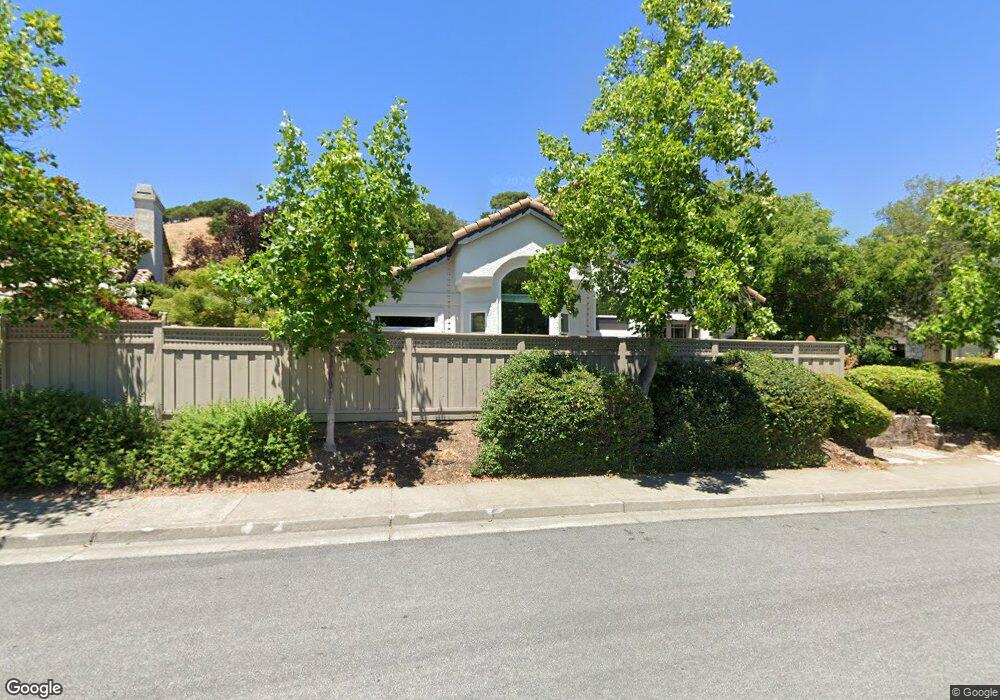
1248 B St Petaluma, CA 94952
Western Petaluma NeighborhoodEstimated Value: $939,000 - $1,050,000
3
Beds
2
Baths
1,535
Sq Ft
$659/Sq Ft
Est. Value
About This Home
This home is located at 1248 B St, Petaluma, CA 94952 and is currently estimated at $1,012,238, approximately $659 per square foot. 1248 B St is a home located in Sonoma County with nearby schools including McNear Elementary School, Petaluma Junior High School, and Petaluma High School.
Ownership History
Date
Name
Owned For
Owner Type
Purchase Details
Closed on
Feb 24, 2014
Sold by
Palmer James E and Palmer Sylvie A
Bought by
Marvin Annessa and Parkes Aaron
Current Estimated Value
Home Financials for this Owner
Home Financials are based on the most recent Mortgage that was taken out on this home.
Original Mortgage
$419,300
Outstanding Balance
$124,247
Interest Rate
4.47%
Mortgage Type
New Conventional
Estimated Equity
$887,991
Purchase Details
Closed on
May 11, 2004
Sold by
Palmer James E and Palmer Sylvie A
Bought by
Palmer James E and Palmer Sylvie A
Home Financials for this Owner
Home Financials are based on the most recent Mortgage that was taken out on this home.
Original Mortgage
$330,000
Interest Rate
5.5%
Mortgage Type
New Conventional
Purchase Details
Closed on
Apr 21, 1997
Sold by
Palmer James E and Palmer Sylvie A
Bought by
Palmer James E and Palmer Sylvie A
Create a Home Valuation Report for This Property
The Home Valuation Report is an in-depth analysis detailing your home's value as well as a comparison with similar homes in the area
Home Values in the Area
Average Home Value in this Area
Purchase History
| Date | Buyer | Sale Price | Title Company |
|---|---|---|---|
| Marvin Annessa | $577,000 | Fidelity National Title Co | |
| Palmer James E | -- | Fidelity National Title Co | |
| Palmer James E | -- | Fidelity National Title Co | |
| Palmer James E | -- | -- |
Source: Public Records
Mortgage History
| Date | Status | Borrower | Loan Amount |
|---|---|---|---|
| Open | Marvin Annessa | $419,300 | |
| Previous Owner | Palmer James E | $330,000 |
Source: Public Records
Tax History
| Year | Tax Paid | Tax Assessment Tax Assessment Total Assessment is a certain percentage of the fair market value that is determined by local assessors to be the total taxable value of land and additions on the property. | Land | Improvement |
|---|---|---|---|---|
| 2025 | $7,590 | $707,311 | $283,169 | $424,142 |
| 2024 | $7,590 | $693,443 | $277,617 | $415,826 |
| 2023 | $7,590 | $679,847 | $272,174 | $407,673 |
| 2022 | $7,348 | $666,518 | $266,838 | $399,680 |
| 2021 | $7,208 | $653,450 | $261,606 | $391,844 |
| 2020 | $7,269 | $646,751 | $258,924 | $387,827 |
| 2019 | $7,178 | $634,071 | $253,848 | $380,223 |
| 2018 | $7,150 | $621,639 | $248,871 | $372,768 |
| 2017 | $6,999 | $609,451 | $243,992 | $365,459 |
| 2016 | $6,833 | $597,502 | $239,208 | $358,294 |
| 2015 | $6,737 | $588,528 | $235,615 | $352,913 |
| 2014 | $3,481 | $297,269 | $107,316 | $189,953 |
Source: Public Records
Map
Nearby Homes
- 12 Haven Dr
- 24 La Cresta Dr
- 100 Orchard Ln
- 1309 D Street Extension
- 11 10th St
- 3 Hill Dr
- 22 Oak Knoll Ct
- 16 7th St
- 712 Oak Terrace
- 618 E St
- 229 Bodega Ave
- 136 Court St
- 131 Liberty St
- 13 Dorenfeld Ct
- 12 Dorenfeld Ct
- 21 Branching Way
- 113 Greenridge Ct
- 720 Petaluma Blvd S Unit 28
- 426 1st St
- 809 Gilardi Dr
Your Personal Tour Guide
Ask me questions while you tour the home.