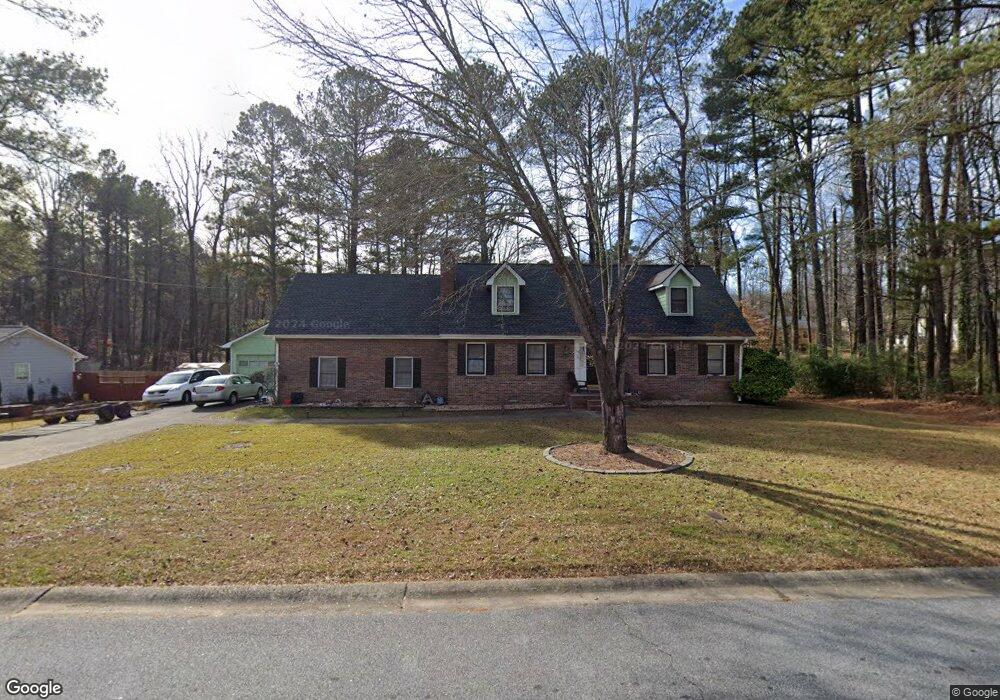
1248 Carriage Trail Unit 4 Norcross, GA 30093
Estimated Value: $318,000 - $360,000
3
Beds
3
Baths
2,084
Sq Ft
$165/Sq Ft
Est. Value
About This Home
This home is located at 1248 Carriage Trail Unit 4, Norcross, GA 30093 and is currently estimated at $344,269, approximately $165 per square foot. 1248 Carriage Trail Unit 4 is a home located in Gwinnett County with nearby schools including Lilburn Middle School, Meadowcreek High School, and McClure Health Science High School.
Ownership History
Date
Name
Owned For
Owner Type
Purchase Details
Closed on
Mar 2, 2004
Sold by
Dang Khai T
Bought by
Dang Nghia T
Current Estimated Value
Home Financials for this Owner
Home Financials are based on the most recent Mortgage that was taken out on this home.
Original Mortgage
$102,500
Interest Rate
5.63%
Mortgage Type
New Conventional
Purchase Details
Closed on
Apr 12, 2000
Sold by
Dang Quan T
Bought by
Dang Khai T
Purchase Details
Closed on
Jul 22, 1997
Sold by
Mays Bobby L
Bought by
Dang Quan T and Dang Khai T
Home Financials for this Owner
Home Financials are based on the most recent Mortgage that was taken out on this home.
Original Mortgage
$112,900
Interest Rate
7.61%
Mortgage Type
New Conventional
Purchase Details
Closed on
Jun 25, 1993
Sold by
Blackwell Jack T
Bought by
Mays Bobby T
Home Financials for this Owner
Home Financials are based on the most recent Mortgage that was taken out on this home.
Original Mortgage
$115,300
Interest Rate
7.48%
Mortgage Type
VA
Create a Home Valuation Report for This Property
The Home Valuation Report is an in-depth analysis detailing your home's value as well as a comparison with similar homes in the area
Home Values in the Area
Average Home Value in this Area
Purchase History
| Date | Buyer | Sale Price | Title Company |
|---|---|---|---|
| Dang Nghia T | $160,000 | -- | |
| Dang Khai T | -- | -- | |
| Dang Quan T | $118,900 | -- | |
| Mays Bobby T | $113,900 | -- |
Source: Public Records
Mortgage History
| Date | Status | Borrower | Loan Amount |
|---|---|---|---|
| Closed | Dang Nghia T | $102,500 | |
| Previous Owner | Dang Quan T | $112,900 | |
| Previous Owner | Mays Bobby T | $115,300 |
Source: Public Records
Tax History Compared to Growth
Tax History
| Year | Tax Paid | Tax Assessment Tax Assessment Total Assessment is a certain percentage of the fair market value that is determined by local assessors to be the total taxable value of land and additions on the property. | Land | Improvement |
|---|---|---|---|---|
| 2025 | -- | $152,000 | $21,120 | $130,880 |
| 2024 | $5,557 | $144,160 | $21,120 | $123,040 |
| 2023 | $5,557 | $137,480 | $24,800 | $112,680 |
| 2022 | $4,624 | $118,840 | $22,400 | $96,440 |
| 2021 | $3,635 | $89,760 | $16,000 | $73,760 |
| 2020 | $3,654 | $89,760 | $16,000 | $73,760 |
| 2019 | $2,922 | $72,600 | $13,600 | $59,000 |
| 2018 | $2,922 | $72,600 | $13,600 | $59,000 |
| 2016 | $2,254 | $53,040 | $10,400 | $42,640 |
| 2015 | $2,039 | $46,400 | $8,000 | $38,400 |
| 2014 | -- | $46,400 | $8,000 | $38,400 |
Source: Public Records
Map
Nearby Homes
- 5775 Dekalb Ln
- 5952 Robin Hood Ln
- 1281 Rockfield Cir
- 5719 Singlebriar Ct
- 1415 Commercial Ct
- 1353 Harbins Ridge Dr Unit 36
- 5665 Terremont Cir
- 903 Redwood Dr
- 1034 Redwood Dr
- 5605 Rock Place Ct
- 936 Six Oaks Cir Unit B
- 6009 Mark Trail Unit 2
- 1002 Rockbridge Rd
- 5738 Brooklyn Ln
- 897 Six Oaks Cir Unit B
- 5969 Wintergreen Rd
- 1258 Roman Point Dr
- 5950 Wintergreen Rd
- 5970 Wintergreen Rd
- 5622 Williamsburg Dr
- 1238 Carriage Trail
- 1249 Carriage Trail
- 5896 Marcelle Ln
- 1239 Carriage Trail
- 5886 Marcelle Ln Unit 3
- 1228 Carriage Trail
- 1259 Carriage Trail
- 5906 Marcelle Ln Unit 3
- 1229 Carriage Trail
- 5916 Marcelle Ln
- 1269 Carriage Trail
- 5876 Marcelle Ln
- 1218 Carriage Trail Unit 4
- 1219 Carriage Trail
- 5643 Button Gwinnett Place Unit 1
- 5926 Marcelle Ln
- 5653 Button Gwinnett Place
- 1279 Carriage Trail
- 5633 Button Gwinnett Place Unit 1
- 5663 Button Gwinnett Place