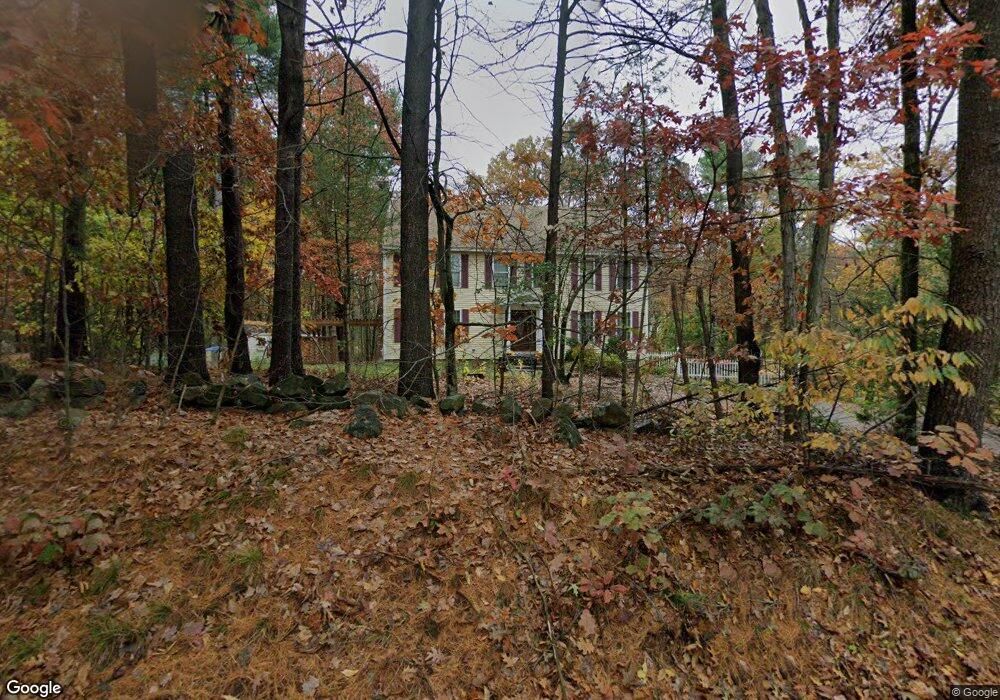
1248 Salem St North Andover, MA 01845
Estimated Value: $933,168 - $1,354,000
4
Beds
3
Baths
2,464
Sq Ft
$429/Sq Ft
Est. Value
About This Home
This home is located at 1248 Salem St, North Andover, MA 01845 and is currently estimated at $1,058,042, approximately $429 per square foot. 1248 Salem St is a home located in Essex County with nearby schools including Annie L Sargent Elementary School, North Andover Middle School, and North Andover High School.
Ownership History
Date
Name
Owned For
Owner Type
Purchase Details
Closed on
Apr 28, 2000
Sold by
Neamtu Danniel G and Neamtu Doreen
Bought by
Diblasi Joseph P and Diblasi Laura
Current Estimated Value
Purchase Details
Closed on
Jun 19, 1995
Sold by
Campbell Roy
Bought by
Lardner Michael F
Purchase Details
Closed on
Jun 30, 1988
Sold by
Hurst Gordon S
Bought by
Campbell Roy J
Create a Home Valuation Report for This Property
The Home Valuation Report is an in-depth analysis detailing your home's value as well as a comparison with similar homes in the area
Home Values in the Area
Average Home Value in this Area
Purchase History
| Date | Buyer | Sale Price | Title Company |
|---|---|---|---|
| Diblasi Joseph P | $386,900 | -- | |
| Lardner Michael F | $281,500 | -- | |
| Campbell Roy J | $290,000 | -- |
Source: Public Records
Mortgage History
| Date | Status | Borrower | Loan Amount |
|---|---|---|---|
| Open | Campbell Roy J | $228,000 | |
| Closed | Campbell Roy J | $255,000 |
Source: Public Records
Tax History Compared to Growth
Tax History
| Year | Tax Paid | Tax Assessment Tax Assessment Total Assessment is a certain percentage of the fair market value that is determined by local assessors to be the total taxable value of land and additions on the property. | Land | Improvement |
|---|---|---|---|---|
| 2025 | $9,494 | $843,200 | $416,000 | $427,200 |
| 2024 | $9,021 | $813,400 | $394,200 | $419,200 |
| 2023 | $8,580 | $701,000 | $332,900 | $368,100 |
| 2022 | $8,339 | $616,300 | $302,400 | $313,900 |
| 2021 | $7,982 | $563,300 | $274,100 | $289,200 |
| 2020 | $7,740 | $563,300 | $274,100 | $289,200 |
| 2019 | $7,554 | $563,300 | $274,100 | $289,200 |
| 2018 | $8,185 | $563,300 | $274,100 | $289,200 |
| 2017 | $7,063 | $494,600 | $214,800 | $279,800 |
| 2016 | $6,705 | $469,900 | $213,500 | $256,400 |
| 2015 | $6,746 | $468,800 | $210,000 | $258,800 |
Source: Public Records
Map
Nearby Homes
- 10 Woodchuck Ln
- Lot 10 Stonecleave Rd
- 114 Stonecleave Rd
- 12 Farnum St
- 7 Sullivan St
- 851 Forest St
- 590 Foster St
- 45 Thistle Rd
- 75 Thistle Rd
- 80 Compass Point Unit 80
- 495 Johnson St
- 378 Salem St
- 34 Rosemont Dr
- 121 Cortland Dr
- 50 Stonecleave Rd
- 480 Sharpners Pond Rd
- 141 Cortland Dr Unit 141
- 141 Cortland Dr
- 660 Sharpners Pond Rd
- 53 Lawrence Rd