Estimated Value: $307,857 - $318,000
--
Bed
--
Bath
1,424
Sq Ft
$220/Sq Ft
Est. Value
About This Home
This home is located at 1248 W 2420 S, Logan, UT 84321 and is currently estimated at $312,964, approximately $219 per square foot. 1248 W 2420 S is a home with nearby schools including Nibley School, Spring Creek Middle School, and South Cache Middle School.
Ownership History
Date
Name
Owned For
Owner Type
Purchase Details
Closed on
Apr 23, 2018
Sold by
Lynch Lance A
Bought by
Jenkins Jennifer C
Current Estimated Value
Home Financials for this Owner
Home Financials are based on the most recent Mortgage that was taken out on this home.
Original Mortgage
$200,000
Outstanding Balance
$171,707
Interest Rate
4.46%
Mortgage Type
Construction
Estimated Equity
$141,257
Purchase Details
Closed on
Nov 10, 2011
Sold by
Spring Creek Crossing Inc
Bought by
Lynch Lance A
Home Financials for this Owner
Home Financials are based on the most recent Mortgage that was taken out on this home.
Original Mortgage
$170,984
Interest Rate
3.95%
Mortgage Type
New Conventional
Purchase Details
Closed on
Nov 24, 2010
Sold by
Spring Creek Crossing Inc
Bought by
Hansen Brianna H
Create a Home Valuation Report for This Property
The Home Valuation Report is an in-depth analysis detailing your home's value as well as a comparison with similar homes in the area
Home Values in the Area
Average Home Value in this Area
Purchase History
| Date | Buyer | Sale Price | Title Company |
|---|---|---|---|
| Jenkins Jennifer C | -- | American Secure Title | |
| Lynch Lance A | -- | Cache Title Company | |
| Hansen Brianna H | -- | Cache Title Company |
Source: Public Records
Mortgage History
| Date | Status | Borrower | Loan Amount |
|---|---|---|---|
| Open | Jenkins Jennifer C | $200,000 | |
| Previous Owner | Lynch Lance A | $170,984 |
Source: Public Records
Tax History Compared to Growth
Tax History
| Year | Tax Paid | Tax Assessment Tax Assessment Total Assessment is a certain percentage of the fair market value that is determined by local assessors to be the total taxable value of land and additions on the property. | Land | Improvement |
|---|---|---|---|---|
| 2025 | $1,366 | $181,135 | $0 | $0 |
| 2024 | $1,489 | $185,325 | $0 | $0 |
| 2023 | $1,546 | $180,125 | $0 | $0 |
| 2022 | $1,609 | $180,125 | $0 | $0 |
| 2021 | $1,264 | $219,733 | $40,000 | $179,733 |
| 2020 | $1,186 | $196,290 | $40,000 | $156,290 |
| 2019 | $1,244 | $196,290 | $40,000 | $156,290 |
| 2018 | $1,075 | $165,545 | $26,000 | $139,545 |
| 2017 | $1,072 | $87,395 | $0 | $0 |
| 2016 | $1,083 | $85,360 | $0 | $0 |
| 2015 | $1,051 | $85,360 | $0 | $0 |
| 2014 | $1,018 | $85,360 | $0 | $0 |
| 2013 | -- | $86,900 | $0 | $0 |
Source: Public Records
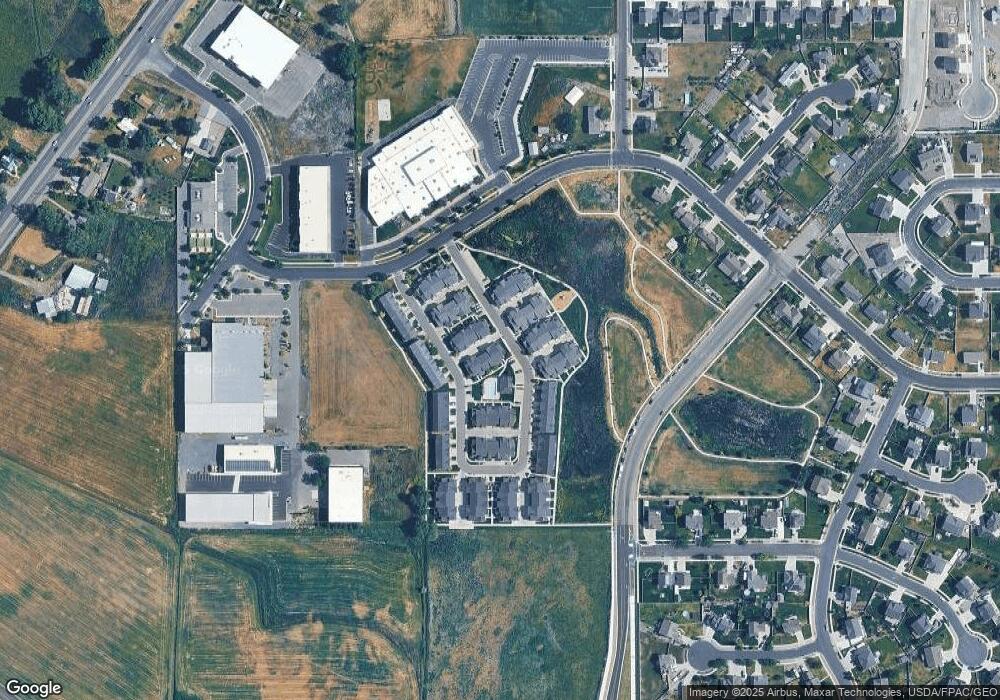
Map
Nearby Homes
- 1254 W 2401 S
- 2485 S 1296 W
- 1140 2260 S
- 2237 S 1150 W Unit 39
- 1045 W 2400 S
- 2301 S 1050 W
- 2301 S 1050 W Unit 99
- Alpine Plan at Firefly Estates - Single Family
- Monroe Plan at Firefly Estates - Single Family
- Gala Plan at Firefly Estates - Single Family
- Phoenix Plan at Firefly Estates - Single Family
- Briarwood Plan at Firefly Estates - Single Family
- Madison Plan at Firefly Estates - Single Family
- Stansbury Plan at Firefly Estates - Single Family
- Hailey Plan at Firefly Estates - Single Family
- Chateau Plan at Firefly Estates - Single Family
- McIntosh Plan at Firefly Estates - Single Family
- 2271 S 1050 W
- 2271 S 1050 W Unit 96
- 2206 S 1120 W Unit 65