Estimated Value: $548,460 - $576,000
4
Beds
3
Baths
2,708
Sq Ft
$208/Sq Ft
Est. Value
About This Home
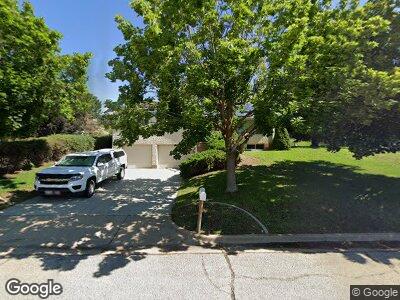
This home is located at 1248 W 4000 N, Ogden, UT 84414 and is currently estimated at $562,615, approximately $207 per square foot. 1248 W 4000 N is a home located in Weber County with nearby schools including Lomond View School, Orion Junior High School, and Weber High School.
Ownership History
Date
Name
Owned For
Owner Type
Purchase Details
Closed on
Apr 26, 2021
Sold by
Monahan Eric Clark
Bought by
Monahan Eric Clark and Monahan Wendy Sue
Current Estimated Value
Home Financials for this Owner
Home Financials are based on the most recent Mortgage that was taken out on this home.
Original Mortgage
$302,500
Outstanding Balance
$276,645
Interest Rate
3%
Mortgage Type
New Conventional
Estimated Equity
$285,970
Purchase Details
Closed on
Apr 18, 2019
Sold by
Monahan Eric Clark
Bought by
Monahan Eric Clark and Monahan Wendy Sue
Home Financials for this Owner
Home Financials are based on the most recent Mortgage that was taken out on this home.
Original Mortgage
$303,905
Interest Rate
4.4%
Mortgage Type
New Conventional
Purchase Details
Closed on
Dec 27, 2000
Sold by
James Alton Clair and James Carolyn S
Bought by
James Clair
Create a Home Valuation Report for This Property
The Home Valuation Report is an in-depth analysis detailing your home's value as well as a comparison with similar homes in the area
Home Values in the Area
Average Home Value in this Area
Purchase History
| Date | Buyer | Sale Price | Title Company |
|---|---|---|---|
| Monahan Eric Clark | -- | Us Title Insurance Agency | |
| Monahan Eric Clark | -- | Us Title Insurance Agency | |
| Monahan Eric Clark | -- | Inwest Title South Ogden | |
| Monahan Eric Clark | -- | Backman Title Services Ltd | |
| James Clair | -- | -- |
Source: Public Records
Mortgage History
| Date | Status | Borrower | Loan Amount |
|---|---|---|---|
| Open | Monahan Eric Clark | $302,500 | |
| Closed | Monahan Eric Clark | $303,905 | |
| Previous Owner | Stain Rusty | $7,000 | |
| Previous Owner | Stain Rusty | $40,000 | |
| Previous Owner | James A Clair | $9,890 | |
| Previous Owner | James A Clair | $81,500 |
Source: Public Records
Tax History Compared to Growth
Tax History
| Year | Tax Paid | Tax Assessment Tax Assessment Total Assessment is a certain percentage of the fair market value that is determined by local assessors to be the total taxable value of land and additions on the property. | Land | Improvement |
|---|---|---|---|---|
| 2024 | $3,341 | $285,449 | $82,231 | $203,218 |
| 2023 | $3,209 | $276,100 | $82,259 | $193,841 |
| 2022 | $3,079 | $271,150 | $79,515 | $191,635 |
| 2021 | $2,607 | $385,000 | $124,602 | $260,398 |
| 2020 | $2,408 | $327,000 | $109,885 | $217,115 |
| 2019 | $2,288 | $295,000 | $109,885 | $185,115 |
| 2018 | $2,197 | $271,000 | $64,753 | $206,247 |
| 2017 | $2,043 | $236,000 | $64,753 | $171,247 |
| 2016 | $1,883 | $117,792 | $35,586 | $82,206 |
| 2015 | $1,744 | $107,088 | $35,586 | $71,502 |
| 2014 | $1,725 | $104,113 | $35,586 | $68,527 |
Source: Public Records
Map
Nearby Homes
- 1248 W 4000 N
- 1234 W 4000 N
- 1276 W 4000 N
- 1276 W 4000 N
- 1243 W 4000 N
- 1139 W 4050 N
- 1259 W 4000 N
- 1229 W 4000 N
- 1139 W Fallow Way Unit 5
- 1169 W 4050 N
- 1169 W 4050 N Unit 8
- 1293 W 4000 N
- 1293 W 4000 N
- 1195 W 4000 N
- 1143 W Fallow Way Unit 6
- 1143 W 4050 N Unit 6
- 1157 W Fallow Way Unit 7
- 1157 W Fallow Way Unit 8
- 1157 W 4050 N
- 1157 W 4050 N Unit 7