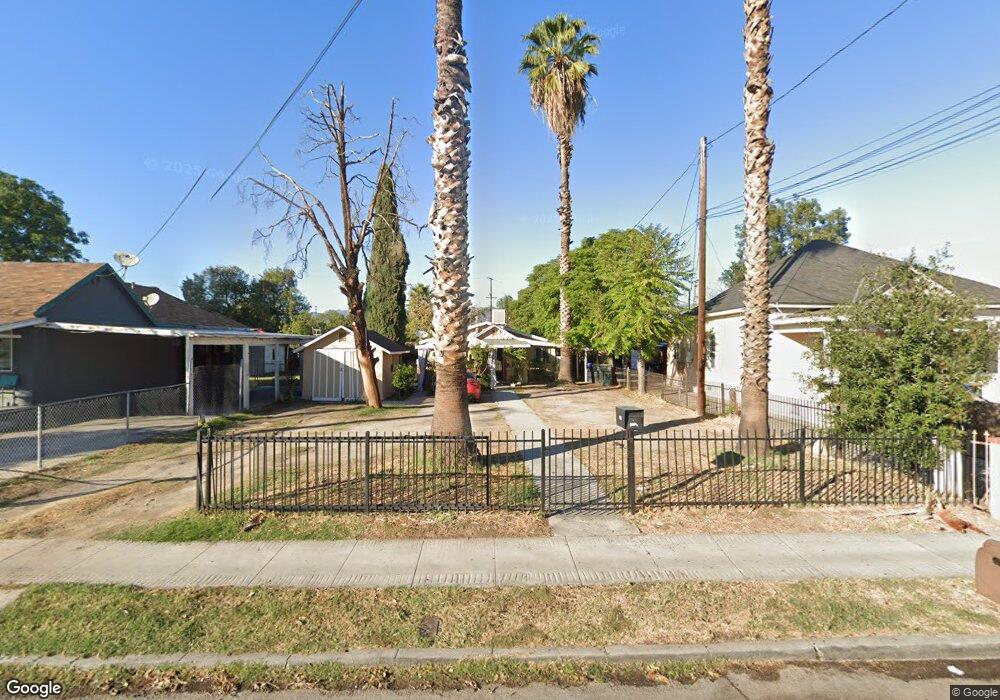
1248 W Congress St San Bernardino, CA 92410
Lytle Creek NeighborhoodEstimated Value: $332,000 - $412,000
2
Beds
1
Bath
671
Sq Ft
$569/Sq Ft
Est. Value
About This Home
This home is located at 1248 W Congress St, San Bernardino, CA 92410 and is currently estimated at $381,928, approximately $569 per square foot. 1248 W Congress St is a home located in San Bernardino County with nearby schools including Lytle Creek Elementary School, Curtis Middle School, and Arroyo Valley High School.
Ownership History
Date
Name
Owned For
Owner Type
Purchase Details
Closed on
Sep 27, 2012
Sold by
Perez Maria C
Bought by
Jimenez Fred R and Jimenez Marina
Current Estimated Value
Purchase Details
Closed on
May 14, 2003
Sold by
Esquivel Karlo E
Bought by
Perez Maria C
Home Financials for this Owner
Home Financials are based on the most recent Mortgage that was taken out on this home.
Original Mortgage
$54,400
Interest Rate
5.71%
Purchase Details
Closed on
May 16, 2002
Sold by
Esquivel Karlo E
Bought by
Perez Maria C
Purchase Details
Closed on
Jun 12, 2001
Sold by
Hud
Bought by
Perez Maria C and Esquivel Karlo E
Purchase Details
Closed on
Nov 13, 1997
Sold by
First Commercial Bank Of Memphis Na
Bought by
Hud
Purchase Details
Closed on
Nov 10, 1997
Sold by
Enriquez Agustin
Bought by
Federal Svgs Bank
Create a Home Valuation Report for This Property
The Home Valuation Report is an in-depth analysis detailing your home's value as well as a comparison with similar homes in the area
Home Values in the Area
Average Home Value in this Area
Purchase History
| Date | Buyer | Sale Price | Title Company |
|---|---|---|---|
| Jimenez Fred R | $11,000 | Investors Title Company | |
| Perez Maria C | -- | Investors Title | |
| Perez Maria C | -- | -- | |
| Perez Maria C | $34,500 | First American Title | |
| Hud | -- | First Southwestern Title | |
| Federal Svgs Bank | $48,607 | First Southwestern Title Co |
Source: Public Records
Mortgage History
| Date | Status | Borrower | Loan Amount |
|---|---|---|---|
| Previous Owner | Perez Maria C | $54,400 |
Source: Public Records
Tax History Compared to Growth
Tax History
| Year | Tax Paid | Tax Assessment Tax Assessment Total Assessment is a certain percentage of the fair market value that is determined by local assessors to be the total taxable value of land and additions on the property. | Land | Improvement |
|---|---|---|---|---|
| 2025 | $1,231 | $86,198 | $28,322 | $57,876 |
| 2024 | $1,231 | $84,508 | $27,767 | $56,741 |
| 2023 | $1,200 | $82,851 | $27,223 | $55,628 |
| 2022 | $1,198 | $81,226 | $26,689 | $54,537 |
| 2021 | $1,197 | $79,634 | $26,166 | $53,468 |
| 2020 | $1,196 | $78,818 | $25,898 | $52,920 |
| 2019 | $1,164 | $77,272 | $25,390 | $51,882 |
| 2018 | $1,152 | $75,757 | $24,892 | $50,865 |
| 2017 | $1,117 | $74,272 | $24,404 | $49,868 |
| 2016 | $1,084 | $72,815 | $23,925 | $48,890 |
| 2015 | $953 | $71,722 | $23,566 | $48,156 |
| 2014 | $927 | $70,317 | $23,104 | $47,213 |
Source: Public Records
Map
Nearby Homes
- 192 S Eureka Ave
- 1170 W Congress St
- 1290 Walnut St
- 1177 W Congress St Unit 45
- 1366 Walnut St
- 1105 W Congress St
- 1099 W Congress St
- 377 S Mount Vernon Ave
- 1329 W 3rd St
- 210 Kendall Ave
- 987 W Rialto Ave
- 157 N J St
- 151 S Muscott St
- 895 W 2nd St
- 340 N I St
- 1082 W 5th St
- 0 North J W 5th St
- 577 Herrington Ave
- 1527 W 4th St
- 1256 W 6th St
- 1254 W Congress St
- 1242 W Congress St
- 1260 W Congress St
- 1236 W Congress St Unit A-B
- 1236 W Congress St
- 1230 W Congress St
- 1266 W Congress St
- 1247 W Belleview St
- 1241 W Belleview St
- 1259 W Belleview St
- 1235 W Belleview St
- 1247 W Congress St
- 1224 W Congress St
- 1272 W Congress St
- 1241 W Congress St
- 1253 W Congress St
- 1235 W Congress St
- 1265 W Belleview St
- 1229 W Belleview St
- 1259 W Congress St