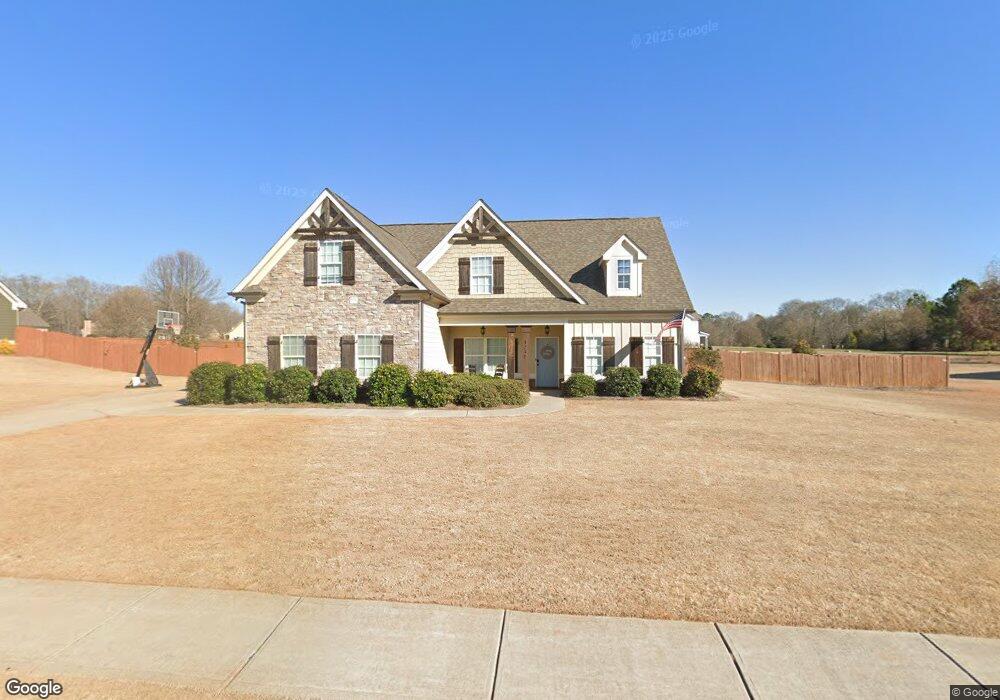
1248 Whitlow Crossing Unit 2J Bishop, GA 30621
Estimated Value: $600,610 - $670,000
4
Beds
4
Baths
2,471
Sq Ft
$256/Sq Ft
Est. Value
About This Home
This home is located at 1248 Whitlow Crossing Unit 2J, Bishop, GA 30621 and is currently estimated at $633,403, approximately $256 per square foot. 1248 Whitlow Crossing Unit 2J is a home located in Oconee County with nearby schools including High Shoals Elementary School, Oconee County Middle School, and Oconee County High School.
Ownership History
Date
Name
Owned For
Owner Type
Purchase Details
Closed on
Dec 21, 2021
Sold by
National Residential Nominee Svcs Inc
Bought by
Setzer Jacob Neil and Setzer Catherine
Current Estimated Value
Home Financials for this Owner
Home Financials are based on the most recent Mortgage that was taken out on this home.
Original Mortgage
$456,000
Outstanding Balance
$419,456
Interest Rate
3.12%
Mortgage Type
New Conventional
Estimated Equity
$213,947
Purchase Details
Closed on
Dec 2, 2021
Sold by
Lewis Kristopher W
Bought by
National Residential Nominee Svcs Inc
Home Financials for this Owner
Home Financials are based on the most recent Mortgage that was taken out on this home.
Original Mortgage
$456,000
Outstanding Balance
$419,456
Interest Rate
3.12%
Mortgage Type
New Conventional
Estimated Equity
$213,947
Purchase Details
Closed on
May 16, 2018
Sold by
Scout Construction Llc
Bought by
Kewis Kristopher W
Purchase Details
Closed on
Feb 28, 2013
Sold by
Evans Mill Development Inc
Bought by
Bank Of Madison
Create a Home Valuation Report for This Property
The Home Valuation Report is an in-depth analysis detailing your home's value as well as a comparison with similar homes in the area
Home Values in the Area
Average Home Value in this Area
Purchase History
| Date | Buyer | Sale Price | Title Company |
|---|---|---|---|
| Setzer Jacob Neil | $480,000 | -- | |
| National Residential Nominee Svcs Inc | $480,000 | -- | |
| Kewis Kristopher W | $329,500 | -- | |
| Bank Of Madison | -- | -- |
Source: Public Records
Mortgage History
| Date | Status | Borrower | Loan Amount |
|---|---|---|---|
| Open | Setzer Jacob Neil | $456,000 |
Source: Public Records
Tax History Compared to Growth
Tax History
| Year | Tax Paid | Tax Assessment Tax Assessment Total Assessment is a certain percentage of the fair market value that is determined by local assessors to be the total taxable value of land and additions on the property. | Land | Improvement |
|---|---|---|---|---|
| 2024 | $4,319 | $222,963 | $30,000 | $192,963 |
| 2023 | $4,206 | $206,134 | $28,000 | $178,134 |
| 2022 | $4,025 | $185,730 | $28,000 | $157,730 |
| 2021 | $3,193 | $138,163 | $18,000 | $120,163 |
| 2020 | $3,018 | $130,415 | $18,000 | $112,415 |
| 2019 | $2,866 | $123,879 | $18,000 | $105,879 |
| 2018 | $2,001 | $82,773 | $18,000 | $64,773 |
| 2017 | $316 | $12,600 | $12,600 | $0 |
| 2016 | $294 | $12,600 | $12,600 | $0 |
| 2015 | $270 | $9,760 | $9,760 | $0 |
| 2014 | $214 | $7,200 | $7,200 | $0 |
| 2013 | -- | $3,220 | $3,220 | $0 |
Source: Public Records
Map
Nearby Homes
- 6534 Whitlow Creek Dr
- 2893 Whitlow Ridge Dr
- 1150 Glen Ln
- 1713 Townside Dr
- 1321 Cemetery Rd
- 2161 Union Church Rd
- 00 Old Bishop Rd
- 0 Old Bishop Rd Unit 10608387
- 1171 Spring Lake Dr
- 1190 Old Bishop Rd
- 1141 Southwind Dr
- 1364 Old Bishop Rd
- 1410 Old Bishop Rd
- 1010 Oconee Forest Ln
- 1101 Spring Valley Way
- 1011 Sharon Place
- 2037 Boulder Ridge Ln
- 1248 Whitlow Crossing
- 1090 Whitlow Crossing
- 1402 Whitlow Crossing Unit 3J
- 1402 Whitlow Crossing
- Various Whitlow Crossing
- 5293 Whitlow Creek Dr Unit 13J
- 5293 Whitlow Creek Dr
- 1227 Whitlow Crossing
- 1365 Whitlow Crossing
- 1548 Whitlow Crossing Unit 4J
- 1548 Whitlow Crossing
- 1097 Whitlow Crossing
- 5431 Whitlow Creek Dr Unit 12J
- 5431 Whitlow Creek Dr
- 6921 Whitlow Creek Dr Unit 5J
- 5096 Whitlow Creek Dr Unit 1
- 5096 Whitlow Creek Dr
- 1525 Whitlow Crossing
- 6787 Whitlow Creek Dr Unit 6J
- 6787 Whitlow Creek Dr