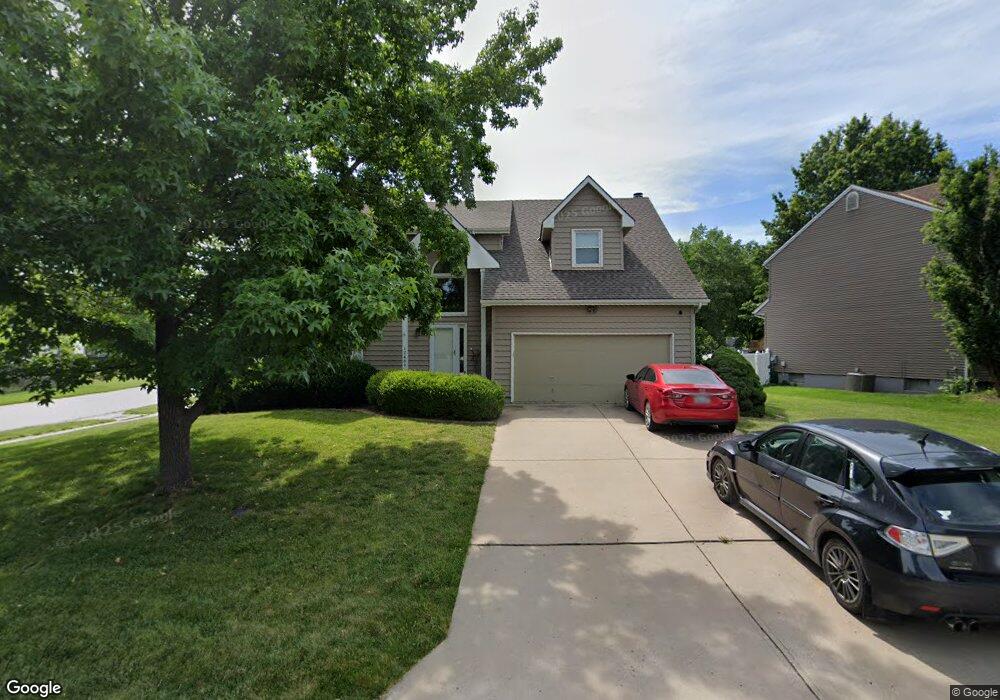
12489 S Shannan Cir Olathe, KS 66062
Estimated Value: $419,000 - $433,000
4
Beds
3
Baths
2,148
Sq Ft
$199/Sq Ft
Est. Value
About This Home
This home is located at 12489 S Shannan Cir, Olathe, KS 66062 and is currently estimated at $426,569, approximately $198 per square foot. 12489 S Shannan Cir is a home located in Johnson County with nearby schools including Heatherstone Elementary School, Pioneer Trail Middle School, and Olathe East Sr High School.
Ownership History
Date
Name
Owned For
Owner Type
Purchase Details
Closed on
Feb 5, 2023
Sold by
Lemons Kenneth G and Lemons Michelle L
Bought by
Lemons Kenneth G and Lemons Michelle L
Current Estimated Value
Purchase Details
Closed on
May 21, 2007
Sold by
Sirva Relocation Llc
Bought by
Leomns Kenneth G and Leomns Michelle L
Home Financials for this Owner
Home Financials are based on the most recent Mortgage that was taken out on this home.
Original Mortgage
$184,500
Interest Rate
6.15%
Mortgage Type
New Conventional
Purchase Details
Closed on
Mar 6, 2007
Sold by
King Joseph C and King Lora K
Bought by
Sirva Relocation Llc
Home Financials for this Owner
Home Financials are based on the most recent Mortgage that was taken out on this home.
Original Mortgage
$184,500
Interest Rate
6.15%
Mortgage Type
New Conventional
Create a Home Valuation Report for This Property
The Home Valuation Report is an in-depth analysis detailing your home's value as well as a comparison with similar homes in the area
Home Values in the Area
Average Home Value in this Area
Purchase History
| Date | Buyer | Sale Price | Title Company |
|---|---|---|---|
| Lemons Kenneth G | -- | None Listed On Document | |
| Leomns Kenneth G | -- | None Available | |
| Sirva Relocation Llc | -- | None Available |
Source: Public Records
Mortgage History
| Date | Status | Borrower | Loan Amount |
|---|---|---|---|
| Previous Owner | Leomns Kenneth G | $184,500 | |
| Previous Owner | Sirva Relocation Llc | $184,500 |
Source: Public Records
Tax History Compared to Growth
Tax History
| Year | Tax Paid | Tax Assessment Tax Assessment Total Assessment is a certain percentage of the fair market value that is determined by local assessors to be the total taxable value of land and additions on the property. | Land | Improvement |
|---|---|---|---|---|
| 2024 | $4,576 | $40,779 | $7,867 | $32,912 |
| 2023 | $4,430 | $38,686 | $6,556 | $32,130 |
| 2022 | $3,991 | $33,936 | $5,707 | $28,229 |
| 2021 | $3,938 | $31,867 | $5,142 | $26,725 |
| 2020 | $3,855 | $30,923 | $4,679 | $26,244 |
| 2019 | $3,622 | $28,876 | $4,679 | $24,197 |
| 2018 | $3,549 | $28,095 | $4,247 | $23,848 |
| 2017 | $3,379 | $26,484 | $3,696 | $22,788 |
| 2016 | $3,038 | $24,449 | $3,696 | $20,753 |
| 2015 | $2,898 | $23,345 | $3,696 | $19,649 |
| 2013 | -- | $21,493 | $3,696 | $17,797 |
Source: Public Records
Map
Nearby Homes
- 12500 S Shannan Cir
- 12464 S Mullen Cir
- 12461 S Mullen Cir
- 12416 S Albervan St
- 12301 S Alden St
- 16204 S Twilight Ln
- 16019 S Twilight Ln
- 15982 S Twilight Ln
- 15998 S Twilight Ln
- 16046 S Twilight Ln
- 16030 S Twilight Ln
- 16063 S Twilight Ln
- 15934 S Twilight Ln
- 16047 S Twilight Ln
- 16014 S Twilight Ln
- 13014 S Constance St
- 13030 S Constance St
- 13028 S Constance St
- 15026 W 129th Terrace
- 15611 W 125th St
- 12491 S Shannan Cir
- 12493 S Shannan Cir
- 12485 S Alden Cir
- 12468 S Acuff Ct
- 12474 S Acuff Ct
- 12488 S Shannan Cir
- 12505 S Shannan Cir
- 12490 S Shannan Cir
- 12466 S Acuff Ct
- 12478 S Acuff Ct
- 12498 S Shannan Cir
- 12483 S Alden Cir
- 12462 S Acuff Ct
- 12502 S Acuff Ct
- 14815 W 124th Terrace
- 12456 S Acuff Ct
- 12505 S Alden Ct
- 12477 S Acuff Ct
- 12481 S Alden Cir
- 12506 S Shannan Cir