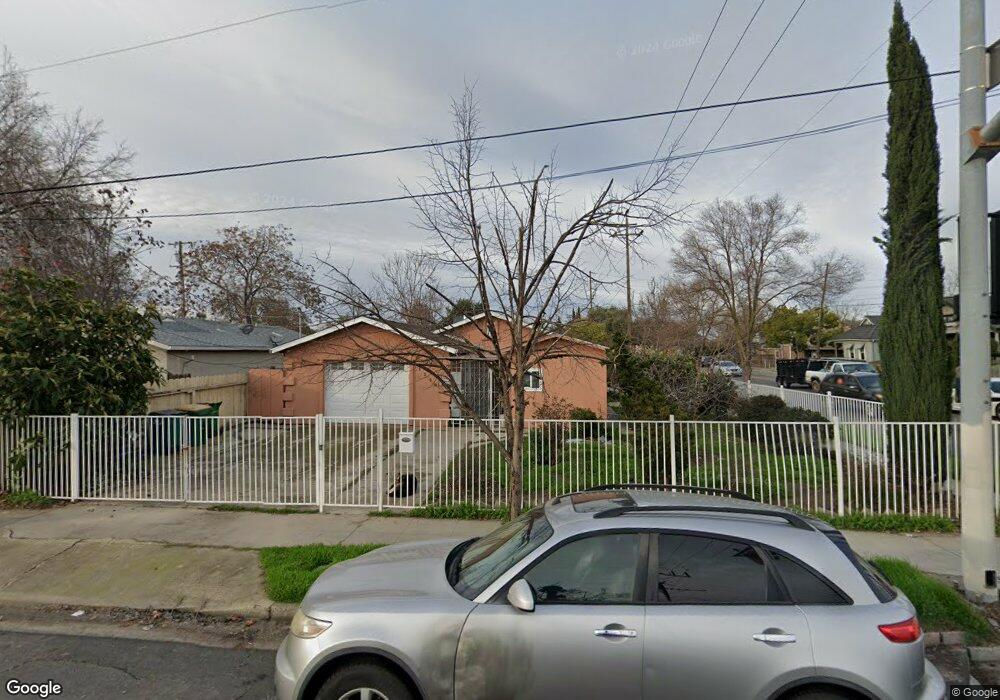
1249 E Hazelton Ave Stockton, CA 95205
East Stockton NeighborhoodEstimated Value: $275,000 - $351,000
3
Beds
1
Bath
1,064
Sq Ft
$283/Sq Ft
Est. Value
About This Home
This home is located at 1249 E Hazelton Ave, Stockton, CA 95205 and is currently estimated at $300,968, approximately $282 per square foot. 1249 E Hazelton Ave is a home located in San Joaquin County with nearby schools including John C. Fremont Elementary School, King Elementary School, and Fillmore Elementary School.
Ownership History
Date
Name
Owned For
Owner Type
Purchase Details
Closed on
May 16, 2008
Sold by
Deutsche Bank National Trust Co
Bought by
Wu Wei and Chen Hui
Current Estimated Value
Home Financials for this Owner
Home Financials are based on the most recent Mortgage that was taken out on this home.
Original Mortgage
$72,000
Interest Rate
6.05%
Mortgage Type
Purchase Money Mortgage
Purchase Details
Closed on
Feb 7, 2008
Sold by
Amos Latruce
Bought by
Deutsche Bank National Trust Co and Gsamp Trust 2005-Wmc3
Purchase Details
Closed on
Oct 15, 2003
Sold by
Mah Chun Seto
Bought by
Amos Latruce
Home Financials for this Owner
Home Financials are based on the most recent Mortgage that was taken out on this home.
Original Mortgage
$124,000
Interest Rate
6.99%
Mortgage Type
Purchase Money Mortgage
Create a Home Valuation Report for This Property
The Home Valuation Report is an in-depth analysis detailing your home's value as well as a comparison with similar homes in the area
Home Values in the Area
Average Home Value in this Area
Purchase History
| Date | Buyer | Sale Price | Title Company |
|---|---|---|---|
| Wu Wei | $90,000 | Lawyers Title Company | |
| Deutsche Bank National Trust Co | $159,490 | Accommodation | |
| Amos Latruce | $155,000 | Chicago Title Co |
Source: Public Records
Mortgage History
| Date | Status | Borrower | Loan Amount |
|---|---|---|---|
| Previous Owner | Wu Wei | $72,000 | |
| Previous Owner | Amos Latruce | $124,000 | |
| Closed | Amos Latruce | $31,000 |
Source: Public Records
Tax History
| Year | Tax Paid | Tax Assessment Tax Assessment Total Assessment is a certain percentage of the fair market value that is determined by local assessors to be the total taxable value of land and additions on the property. | Land | Improvement |
|---|---|---|---|---|
| 2025 | $1,412 | $118,205 | $35,460 | $82,745 |
| 2024 | $1,388 | $115,888 | $34,765 | $81,123 |
| 2023 | $1,355 | $113,617 | $34,084 | $79,533 |
| 2022 | $1,317 | $111,390 | $33,416 | $77,974 |
| 2021 | $1,264 | $109,207 | $32,761 | $76,446 |
| 2020 | $1,288 | $108,089 | $32,426 | $75,663 |
| 2019 | $1,281 | $105,971 | $31,791 | $74,180 |
| 2018 | $1,256 | $103,894 | $31,168 | $72,726 |
| 2017 | $1,188 | $101,857 | $30,557 | $71,300 |
| 2016 | $1,208 | $99,860 | $29,958 | $69,902 |
| 2014 | $879 | $75,000 | $23,000 | $52,000 |
Source: Public Records
Map
Nearby Homes
- 1237 E Hazelton Ave
- 336 S Airport Way
- 345 S Pilgrim St
- 1224 E Lafayette St
- 29 S Sierra Nevada St
- 921 S Aurora St
- 1211 E Main St
- 709 E Sonora St
- 1121 E Clay St
- 1200 E Miner Ave
- 2006 E Lafayette St
- 143 S California St
- 446 E Anderson St
- 2111 E Hazelton Ave
- 1215 S American St
- 329 S San Joaquin St
- 203 E Hazelton Ave
- 2117 E Washington St
- 727 E Lindsay St
- 442 N Sutter St
- 527 S Airport Way
- 1231 E Hazelton Ave
- 1307 E Hazelton Ave
- 519 S Airport Way
- 1311 E Hazelton Ave
- 524 S Airport Way
- 1246 E Church St
- 1238 E Church St
- 1248 E Hazelton Ave
- 1238 E Hazelton Ave
- 520 S Airport Way
- 1315 E Hazelton Ave
- 1230 E Church St
- 1230 E Hazelton Ave
- 506 S Airport Way
- 1222 E Church St Unit A /B
- 1222 E Church St
- 1218 E Hazelton Ave
- 1308 E Church St
- 1316 E Hazelton Ave
Your Personal Tour Guide
Ask me questions while you tour the home.