1249 Kaylene Ct San Jose, CA 95127
East Foothills NeighborhoodEstimated Value: $1,574,000 - $1,998,000
4
Beds
3
Baths
2,430
Sq Ft
$724/Sq Ft
Est. Value
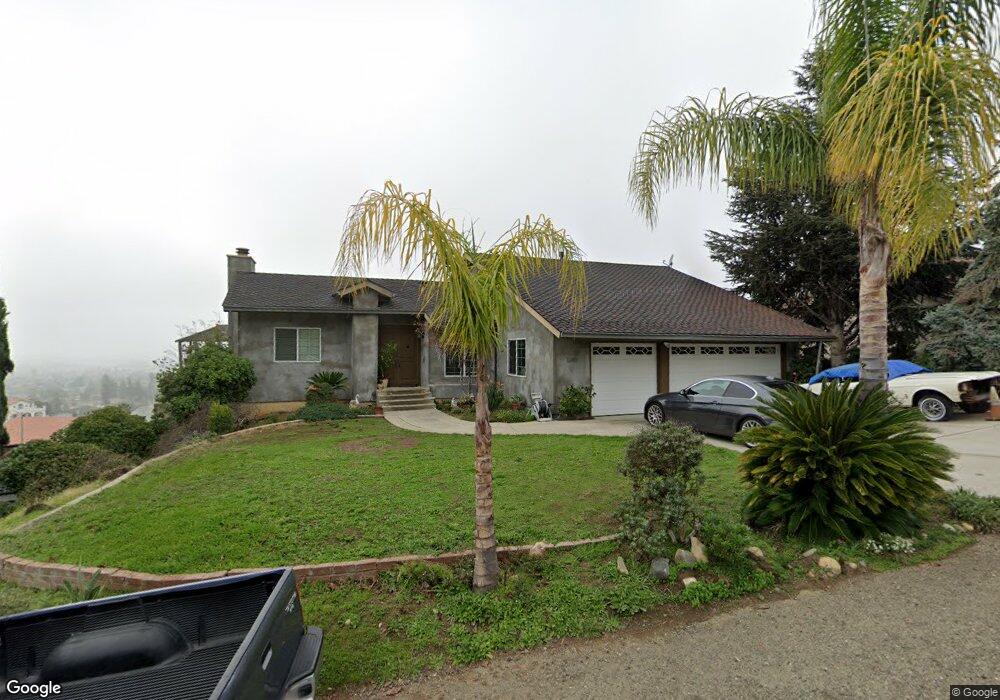
About This Home
This home is located at 1249 Kaylene Ct, San Jose, CA 95127 and is currently estimated at $1,758,236, approximately $723 per square foot. 1249 Kaylene Ct is a home located in Santa Clara County with nearby schools including Mt. Pleasant High School, Voices College-Bound Language Academy at Mt. Pleasant, and Rocketship Academy Brilliant Minds.
Ownership History
Date
Name
Owned For
Owner Type
Purchase Details
Closed on
Jun 3, 2002
Sold by
Ayllon Wagner and Ayllon Amelia
Bought by
Landeros Alejandro and Landeros Edelmira
Current Estimated Value
Home Financials for this Owner
Home Financials are based on the most recent Mortgage that was taken out on this home.
Original Mortgage
$600,000
Outstanding Balance
$261,563
Interest Rate
7.25%
Estimated Equity
$1,496,673
Purchase Details
Closed on
Aug 28, 2001
Sold by
Kubie John H and Kubie Pearl R
Bought by
Ayllon Wagner and Ayllon Amelia
Home Financials for this Owner
Home Financials are based on the most recent Mortgage that was taken out on this home.
Original Mortgage
$433,500
Interest Rate
8.45%
Create a Home Valuation Report for This Property
The Home Valuation Report is an in-depth analysis detailing your home's value as well as a comparison with similar homes in the area
Home Values in the Area
Average Home Value in this Area
Purchase History
| Date | Buyer | Sale Price | Title Company |
|---|---|---|---|
| Landeros Alejandro | $750,000 | Chicago Title Co | |
| Ayllon Wagner | $578,000 | North American Title Co |
Source: Public Records
Mortgage History
| Date | Status | Borrower | Loan Amount |
|---|---|---|---|
| Open | Landeros Alejandro | $600,000 | |
| Previous Owner | Ayllon Wagner | $433,500 | |
| Closed | Ayllon Wagner | $15,000 | |
| Closed | Landeros Alejandro | $75,000 |
Source: Public Records
Tax History Compared to Growth
Tax History
| Year | Tax Paid | Tax Assessment Tax Assessment Total Assessment is a certain percentage of the fair market value that is determined by local assessors to be the total taxable value of land and additions on the property. | Land | Improvement |
|---|---|---|---|---|
| 2025 | $15,178 | $1,107,958 | $498,580 | $609,378 |
| 2024 | $15,178 | $1,086,234 | $488,804 | $597,430 |
| 2023 | $14,645 | $1,064,936 | $479,220 | $585,716 |
| 2022 | $14,543 | $1,044,056 | $469,824 | $574,232 |
| 2021 | $14,678 | $1,023,585 | $460,612 | $562,973 |
| 2020 | $14,108 | $1,013,090 | $455,889 | $557,201 |
| 2019 | $13,778 | $993,226 | $446,950 | $546,276 |
| 2018 | $13,405 | $973,752 | $438,187 | $535,565 |
| 2017 | $13,232 | $954,660 | $429,596 | $525,064 |
| 2016 | $12,830 | $935,942 | $421,173 | $514,769 |
| 2015 | $12,702 | $910,300 | $409,600 | $500,700 |
| 2014 | $10,639 | $778,000 | $350,100 | $427,900 |
Source: Public Records
Map
Nearby Homes
- 3514 Ramstad Dr
- 3472 Kaylene Dr
- 3457 Ramstad Dr
- 10150 Clayton Rd
- 1310 Park Pleasant Cir
- 3341 Hickerson Dr
- 14862 Watters Dr
- 3382 Mount Wilson Dr
- 14440 Victoria Ct
- 3434 Dominick Ct
- 3253 Arthur Ave
- 1245 Fleming Ave
- 1122 Lancelot Ln
- 801 Fleming Ave
- 10230 Griffith St
- 681 Heirloom Ct
- 14545 Jerilyn Dr
- 3549 Columbine Dr
- 366 Cureton Place
- 10281 Murtha Dr
- 1245 Kaylene Ct
- 1257 Kaylene Ct
- 0 Kaylene Ct Unit ML80828955
- 1239 Kaylene Ct
- 1261 Kaylene Ct
- 1241 Ridgeline Ct
- 1247 Ridgeline Ct
- 1235 Ridgeline Ct
- 3525 Ramstad Dr
- 3502 Ramstad Dr
- 3496 Ramstad Dr
- 1253 Ridgeline Ct
- 3508 Ramstad Dr
- 3489 Kaylene Dr
- 1229 Ridgeline Ct
- 1259 Ridgeline Ct
- 1258 Hickerson Ct
- 3520 Ramstad Dr
- 1265 Ridgeline Ct
- 3480 Ramstad Dr