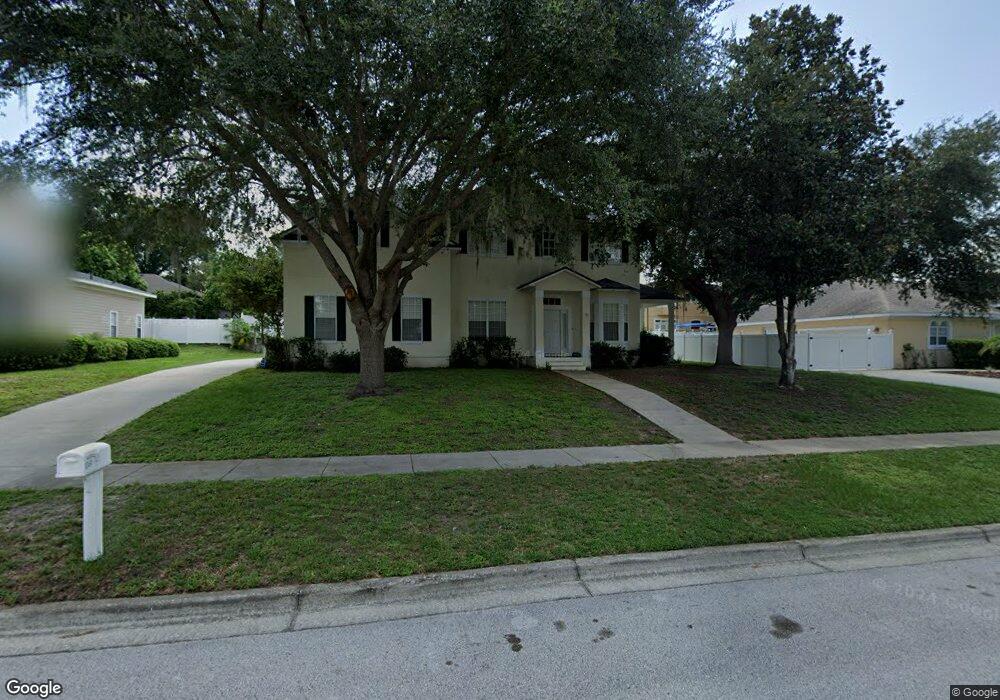
1249 Shorecrest Cir Clermont, FL 34711
Estimated Value: $532,000 - $822,000
4
Beds
4
Baths
4,198
Sq Ft
$154/Sq Ft
Est. Value
About This Home
This home is located at 1249 Shorecrest Cir, Clermont, FL 34711 and is currently estimated at $644,998, approximately $153 per square foot. 1249 Shorecrest Cir is a home located in Lake County with nearby schools including Aurelia Cole Academy, South Lake High School, and South Lake Montessori School.
Ownership History
Date
Name
Owned For
Owner Type
Purchase Details
Closed on
Nov 30, 2016
Sold by
Shiver Barry and Shiver Ophelia
Bought by
Lee Kevin and Lee Eliza
Current Estimated Value
Home Financials for this Owner
Home Financials are based on the most recent Mortgage that was taken out on this home.
Original Mortgage
$252,345
Outstanding Balance
$205,198
Interest Rate
3.75%
Mortgage Type
FHA
Estimated Equity
$439,800
Purchase Details
Closed on
May 27, 2009
Sold by
Hsbc Mortgage Services Inc
Bought by
Shiver Barry and Shiver Ophelia
Home Financials for this Owner
Home Financials are based on the most recent Mortgage that was taken out on this home.
Original Mortgage
$194,250
Interest Rate
4.8%
Mortgage Type
VA
Purchase Details
Closed on
May 28, 2008
Sold by
Cavender Michael J and Cavender Amy J
Bought by
Hsbc Mortgage Services Inc
Purchase Details
Closed on
May 14, 2008
Sold by
Cavender Michael J
Bought by
Hsbc Mortgage Services Inc
Purchase Details
Closed on
Sep 27, 2005
Sold by
Cendant Mobility Relocation Corp
Bought by
Cavender Michael J
Home Financials for this Owner
Home Financials are based on the most recent Mortgage that was taken out on this home.
Original Mortgage
$295,920
Interest Rate
6.8%
Mortgage Type
Purchase Money Mortgage
Purchase Details
Closed on
Jun 27, 2005
Sold by
Pearson Bruce and Pearson Eloise
Bought by
Cendant Mobility Relocation Co
Home Financials for this Owner
Home Financials are based on the most recent Mortgage that was taken out on this home.
Original Mortgage
$73,980
Interest Rate
5.37%
Mortgage Type
Stand Alone Second
Purchase Details
Closed on
Oct 22, 2004
Sold by
Indian Shores Development Corp
Bought by
Pearson Bruce and Pearson Eloise
Home Financials for this Owner
Home Financials are based on the most recent Mortgage that was taken out on this home.
Original Mortgage
$192,000
Interest Rate
8.5%
Mortgage Type
New Conventional
Purchase Details
Closed on
Dec 2, 1999
Sold by
Horacek Charles T and Horacek Deborah S
Bought by
Indian Shores Dev Corp
Home Financials for this Owner
Home Financials are based on the most recent Mortgage that was taken out on this home.
Original Mortgage
$229,000
Interest Rate
7.99%
Purchase Details
Closed on
Jun 30, 1995
Sold by
Indian Shores Dev Corp
Bought by
Horacek Charles T and Horacek Deborah S
Home Financials for this Owner
Home Financials are based on the most recent Mortgage that was taken out on this home.
Original Mortgage
$23,800
Interest Rate
7.79%
Create a Home Valuation Report for This Property
The Home Valuation Report is an in-depth analysis detailing your home's value as well as a comparison with similar homes in the area
Home Values in the Area
Average Home Value in this Area
Purchase History
| Date | Buyer | Sale Price | Title Company |
|---|---|---|---|
| Lee Kevin | $257,000 | Prominence Title & Escrow Ll | |
| Shiver Barry | $194,300 | Attorney | |
| Hsbc Mortgage Services Inc | -- | None Available | |
| Hsbc Mortgage Services Inc | -- | Attorney | |
| Cavender Michael J | $369,900 | Sunbelt Title Agency | |
| Cendant Mobility Relocation Co | $369,900 | Sunbelt Title Agency | |
| Pearson Bruce | $240,000 | -- | |
| Indian Shores Dev Corp | $26,000 | -- | |
| Horacek Charles T | $28,128 | -- |
Source: Public Records
Mortgage History
| Date | Status | Borrower | Loan Amount |
|---|---|---|---|
| Open | Lee Kevin | $252,345 | |
| Previous Owner | Shiver Barry | $194,250 | |
| Previous Owner | Cavender Michael J | $295,920 | |
| Previous Owner | Cendant Mobility Relocation Co | $73,980 | |
| Previous Owner | Pearson Bruce | $192,000 | |
| Previous Owner | Indian Shores Dev Corp | $229,000 | |
| Previous Owner | Horacek Charles T | $23,800 | |
| Closed | Pearson Bruce | $48,000 |
Source: Public Records
Tax History Compared to Growth
Tax History
| Year | Tax Paid | Tax Assessment Tax Assessment Total Assessment is a certain percentage of the fair market value that is determined by local assessors to be the total taxable value of land and additions on the property. | Land | Improvement |
|---|---|---|---|---|
| 2025 | $5,037 | $351,920 | -- | -- |
| 2024 | $5,037 | $351,920 | -- | -- |
| 2023 | $5,037 | $331,720 | $0 | $0 |
| 2022 | $4,891 | $322,060 | $0 | $0 |
| 2021 | $3,866 | $268,408 | $0 | $0 |
| 2020 | $3,834 | $264,703 | $0 | $0 |
| 2019 | $3,913 | $258,752 | $0 | $0 |
| 2018 | $3,761 | $253,928 | $0 | $0 |
| 2017 | $4,236 | $238,540 | $0 | $0 |
| 2016 | $4,112 | $227,262 | $0 | $0 |
| 2015 | $3,899 | $209,015 | $0 | $0 |
| 2014 | $2,898 | $203,305 | $0 | $0 |
Source: Public Records
Map
Nearby Homes
- 1511 W Magnolia St
- 1421 16th St
- 1224 Shorecrest Cir
- 0 County Road 561 Unit A MFRG5081619
- 1241 W Lakeshore Dr
- 1130 W Minnehaha Ave
- 1120 W Magnolia St
- 1249 12th St
- 955 Seminole St
- 1217 10th St
- 969 Chestnut St
- 901 12th St
- 0 W Highway 50
- 999 W Juniata St
- 1401 W Hwy 50 Unit 61
- 1401 W Highway 50 Unit 179
- 1401 W Highway 50 Unit 152
- 1401 W Highway 50 Unit 35
- 1401 W Highway 50 Unit 100
- 1401 W Highway 50 Unit 143
- 1251 Shorecrest Cir
- 1247 Shorecrest Cir
- 1606 Oak Hollow Rd
- 1604 Oak Hollow Rd
- 1608 Oak Hollow Rd
- 1245 Shorecrest Cir
- 1253 Shorecrest Cir
- 1610 Oak Hollow Rd
- 1252 Shorecrest Cir
- 1607 Oak Hollow Rd
- 1605 Oak Hollow Rd
- 1243 Shorecrest Cir
- 1609 Oak Hollow Rd
- 1612 Oak Hollow Rd
- 1611 Oak Hollow Rd
- 1603 Oak Hollow Rd
- Oak Hollow Rd
- 1258 Shorecrest Cir
- 1608 Indian Shore Dr
- 1256 Shorecrest Cir