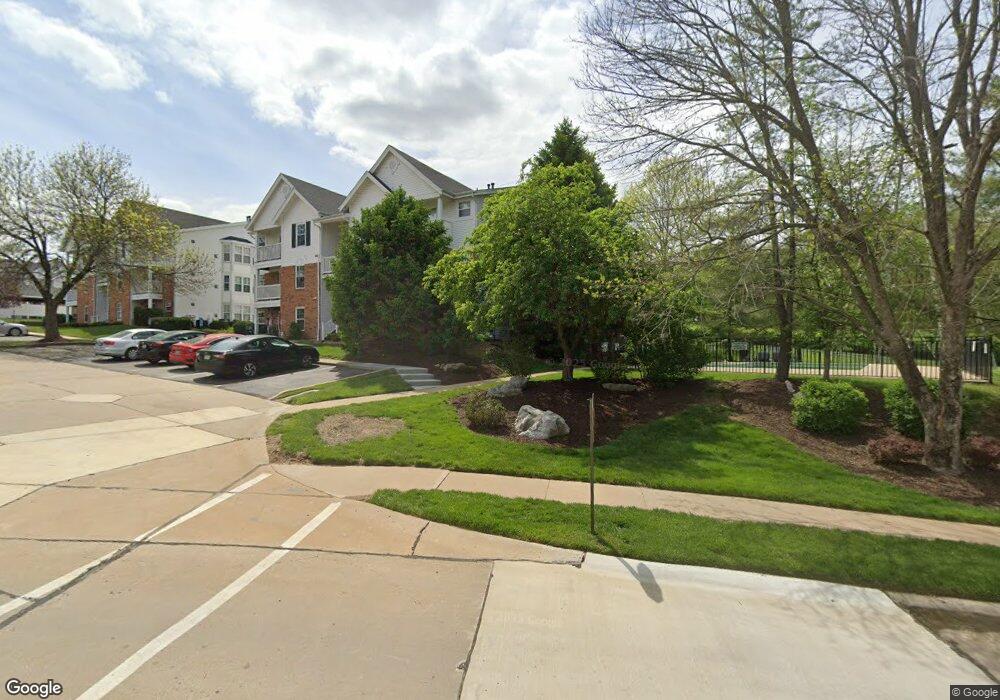
1249 Woodland Point Dr Unit G Saint Louis, MO 63146
Estimated Value: $173,000 - $183,000
2
Beds
2
Baths
1,050
Sq Ft
$168/Sq Ft
Est. Value
About This Home
This home is located at 1249 Woodland Point Dr Unit G, Saint Louis, MO 63146 and is currently estimated at $176,643, approximately $168 per square foot. 1249 Woodland Point Dr Unit G is a home located in St. Louis County with nearby schools including River Bend Elementary School, Parkway Central Middle School, and Parkway Central High School.
Ownership History
Date
Name
Owned For
Owner Type
Purchase Details
Closed on
Apr 27, 2011
Sold by
Zoroufchi Teresa and Zoroufchi Jaffar
Bought by
Zoroufchi Teresa
Current Estimated Value
Purchase Details
Closed on
Sep 22, 1998
Sold by
Tailor Rajeev C
Bought by
Zoroufchi Jafffar and Zoroufchi Teresa
Home Financials for this Owner
Home Financials are based on the most recent Mortgage that was taken out on this home.
Original Mortgage
$79,000
Interest Rate
6.6%
Purchase Details
Closed on
Mar 5, 1998
Sold by
Taylor Morley Inc
Bought by
Tailor Rajeev C
Home Financials for this Owner
Home Financials are based on the most recent Mortgage that was taken out on this home.
Original Mortgage
$89,300
Interest Rate
6.5%
Mortgage Type
Assumption
Create a Home Valuation Report for This Property
The Home Valuation Report is an in-depth analysis detailing your home's value as well as a comparison with similar homes in the area
Home Values in the Area
Average Home Value in this Area
Purchase History
| Date | Buyer | Sale Price | Title Company |
|---|---|---|---|
| Zoroufchi Teresa | -- | None Available | |
| Zoroufchi Jafffar | -- | -- | |
| Tailor Rajeev C | -- | -- | |
| Tailor Rajeev C | -- | -- |
Source: Public Records
Mortgage History
| Date | Status | Borrower | Loan Amount |
|---|---|---|---|
| Closed | Zoroufchi Jafffar | $79,000 | |
| Previous Owner | Tailor Rajeev C | $89,300 |
Source: Public Records
Tax History Compared to Growth
Tax History
| Year | Tax Paid | Tax Assessment Tax Assessment Total Assessment is a certain percentage of the fair market value that is determined by local assessors to be the total taxable value of land and additions on the property. | Land | Improvement |
|---|---|---|---|---|
| 2025 | $1,939 | $30,820 | $9,580 | $21,240 |
| 2024 | $1,939 | $29,050 | $5,000 | $24,050 |
| 2023 | $1,861 | $29,050 | $5,000 | $24,050 |
| 2022 | $1,704 | $24,170 | $7,180 | $16,990 |
| 2021 | $1,697 | $24,170 | $7,180 | $16,990 |
| 2020 | $1,603 | $21,910 | $5,990 | $15,920 |
| 2019 | $1,568 | $21,910 | $5,990 | $15,920 |
| 2018 | $1,456 | $18,830 | $2,790 | $16,040 |
| 2017 | $1,416 | $18,830 | $2,790 | $16,040 |
| 2016 | $1,427 | $18,030 | $3,990 | $14,040 |
| 2015 | $1,495 | $18,030 | $3,990 | $14,040 |
| 2014 | -- | $17,660 | $4,830 | $12,830 |
Source: Public Records
Map
Nearby Homes
- 13118 Hickory Mill Ct
- 1324 Golden Point Dr
- 13101 Mill Crossing Ct Unit 306
- 13101 Mill Crossing Ct Unit 302
- 13136 Oldfarm Dr
- 13041 Tiger Lily Ct Unit 10
- 1163 Mill Crossing Dr Unit 103
- 12924 Autumn View Dr
- 1202 Creve Coeur Crossing Ln Unit G
- 13104 Fourposter Ct
- 12917 Portulaca Dr Unit 225
- 1444 Nancy Lee Dr
- 12929 Portulaca Dr Unit 310
- 13209 Matador Dr Unit 3
- 1239 Creve Coeur Crossing Ln Unit C
- 12964 Autumn View Dr
- 1121 Matador Dr Unit 1
- 12812 Portulaca Dr Unit K
- 1150 Rue La Chelle Walk Unit 1150
- 13033 King Arthur Spur
- 1249 Woodland Point Dr Unit C
- 1249 Woodland Point Dr Unit I
- 1249 Woodland Point Dr Unit A
- 1249 Woodland Point Dr Unit J
- 1249 Woodland Point Dr Unit F
- 1249 Woodland Point Dr Unit B
- 1249 Woodland Point Dr Unit D
- 1249 Woodland Point Dr Unit K
- 1241 Woodland Point Dr Unit C
- 1241 Woodland Point Dr Unit J
- 1241 Woodland Point Dr Unit I
- 1241 Woodland Point Dr Unit G
- 1241 Woodland Point Dr Unit K
- 1241 Woodland Point Dr Unit H
- 1241 Woodland Point Dr Unit A
- 1241 Woodland Point Dr Unit B
- 1241 Woodland Point Dr Unit F
- 1241 Woodland Point Dr Unit D
- 1241 Woodland Point Dr Unit E
- 1241 Woodland Point Dr Unit L