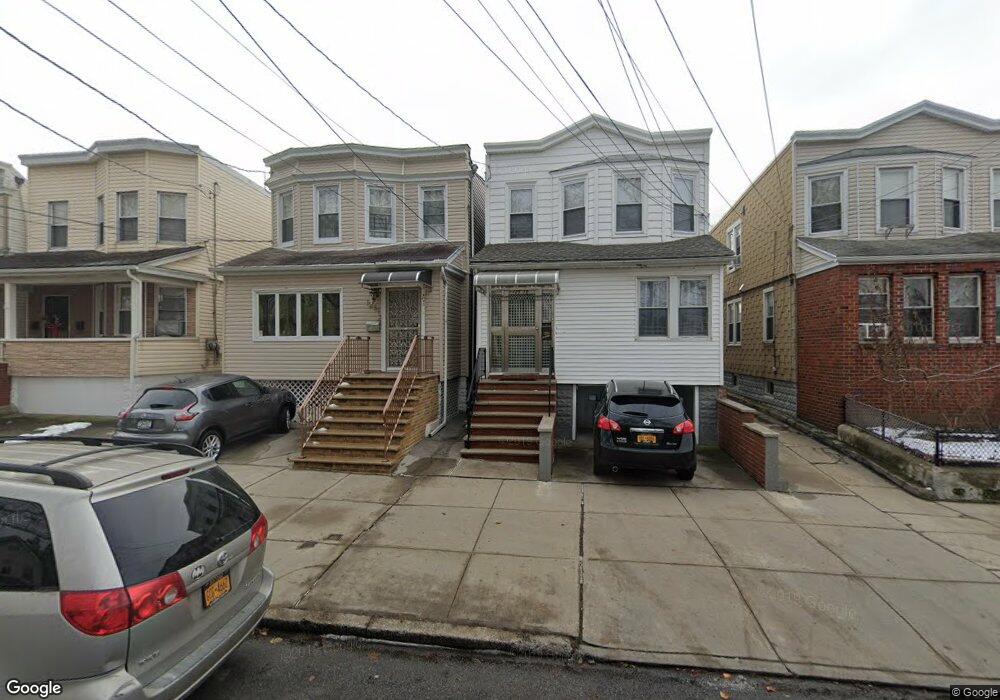
125-12 22nd Ave Flushing, NY 11356
College Point NeighborhoodEstimated Value: $804,000 - $1,068,000
--
Bed
1
Bath
1,640
Sq Ft
$542/Sq Ft
Est. Value
About This Home
This home is located at 125-12 22nd Ave, Flushing, NY 11356 and is currently estimated at $889,378, approximately $542 per square foot. 125-12 22nd Ave is a home located in Queens County with nearby schools including P.S. 29, Jhs 185 Edward Bleeker, and Flushing High School.
Ownership History
Date
Name
Owned For
Owner Type
Purchase Details
Closed on
Sep 13, 2007
Sold by
Dml Property Holdings Llc
Bought by
Tavarez Ascania
Current Estimated Value
Home Financials for this Owner
Home Financials are based on the most recent Mortgage that was taken out on this home.
Original Mortgage
$544,000
Outstanding Balance
$345,833
Interest Rate
6.65%
Mortgage Type
Purchase Money Mortgage
Estimated Equity
$543,545
Purchase Details
Closed on
Jun 20, 2007
Sold by
Lopez David M
Bought by
Dml Property Holdings Llc
Home Financials for this Owner
Home Financials are based on the most recent Mortgage that was taken out on this home.
Original Mortgage
$47,170
Interest Rate
6.18%
Purchase Details
Closed on
May 7, 2007
Sold by
Koenig Michael
Bought by
Lopez David M
Home Financials for this Owner
Home Financials are based on the most recent Mortgage that was taken out on this home.
Original Mortgage
$47,170
Interest Rate
6.18%
Create a Home Valuation Report for This Property
The Home Valuation Report is an in-depth analysis detailing your home's value as well as a comparison with similar homes in the area
Home Values in the Area
Average Home Value in this Area
Purchase History
| Date | Buyer | Sale Price | Title Company |
|---|---|---|---|
| Tavarez Ascania | $680,000 | -- | |
| Tavarez Ascania | $680,000 | -- | |
| Dml Property Holdings Llc | -- | -- | |
| Dml Property Holdings Llc | -- | -- | |
| Lopez David M | $471,700 | -- | |
| Lopez David M | $471,700 | -- |
Source: Public Records
Mortgage History
| Date | Status | Borrower | Loan Amount |
|---|---|---|---|
| Open | Tavarez Ascania | $544,000 | |
| Closed | Tavarez Ascania | $544,000 | |
| Previous Owner | Lopez David M | $47,170 | |
| Previous Owner | Lopez David M | $377,360 |
Source: Public Records
Tax History Compared to Growth
Tax History
| Year | Tax Paid | Tax Assessment Tax Assessment Total Assessment is a certain percentage of the fair market value that is determined by local assessors to be the total taxable value of land and additions on the property. | Land | Improvement |
|---|---|---|---|---|
| 2025 | $6,348 | $34,985 | $6,622 | $28,363 |
| 2024 | $6,360 | $33,005 | $5,865 | $27,140 |
| 2023 | $6,192 | $32,227 | $5,511 | $26,716 |
| 2022 | $6,146 | $53,460 | $8,700 | $44,760 |
| 2021 | $6,207 | $52,680 | $8,700 | $43,980 |
| 2020 | $5,875 | $49,380 | $8,700 | $40,680 |
| 2019 | $5,461 | $48,720 | $8,700 | $40,020 |
| 2018 | $5,177 | $26,856 | $4,973 | $21,883 |
| 2017 | $5,175 | $26,856 | $6,104 | $20,752 |
| 2016 | $4,838 | $26,856 | $6,104 | $20,752 |
| 2015 | $3,027 | $24,295 | $8,487 | $15,808 |
| 2014 | $3,027 | $22,920 | $9,600 | $13,320 |
Source: Public Records
Map
Nearby Homes
- 2201 125th St
- 22-03 125th St
- 2220 126th St
- 22-40 125th St
- 126-01 23rd Ave
- 2232 124th St
- 2105 123rd St
- 18-43 124th St
- 123-09 20th Ave
- 20-11 College Point Blvd
- 1830 124th St
- 23-24 128th St
- 20-22 College Point Blvd
- 122-08 23rd Ave
- 2045 121st St
- 18-11 123rd St Unit 4F
- 12411 25th Ave
- 2354 128th St
- 23-47 128th St
- 124-17 18th Ave
- 12512 22nd Ave
- 12510 22nd Ave
- 12516 22nd Ave
- 12512 22nd Ave
- 12510 22nd Ave
- 12510 22nd Ave
- 12510 22nd Ave Unit 2 Fl
- 12510 22nd Ave Unit 2 Fl
- 12508 22nd Ave
- 12518 22nd Ave
- 22-18 126th St
- 22-3 125th St
- 22-12 126th St
- 12504 22nd Ave
- 12520 22nd Ave
- 2214 126th St
- 22-14 126th St Unit 1st Fl
- 12504 22nd Ave Unit 2F
- 2211 125th St
- 22-11 125th St