Estimated Value: $174,619 - $211,000
3
Beds
1
Bath
988
Sq Ft
$196/Sq Ft
Est. Value
About This Home
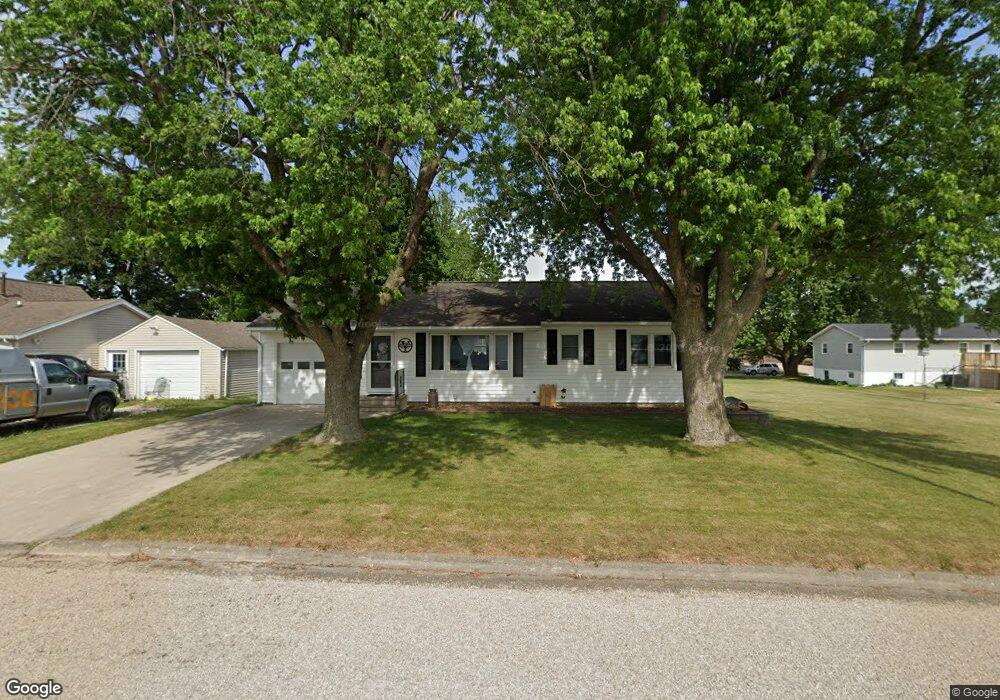
This home is located at 125 7th St, Jesup, IA 50648 and is currently estimated at $193,405, approximately $195 per square foot. 125 7th St is a home located in Buchanan County with nearby schools including Jesup Elementary School, Jesup Middle School, and Jesup High School.
Ownership History
Date
Name
Owned For
Owner Type
Purchase Details
Closed on
May 16, 2022
Sold by
Youngblut and Megahn
Bought by
Harken Alexander J and Schares Alisha A
Current Estimated Value
Home Financials for this Owner
Home Financials are based on the most recent Mortgage that was taken out on this home.
Original Mortgage
$128,000
Outstanding Balance
$121,651
Interest Rate
5.3%
Mortgage Type
New Conventional
Estimated Equity
$71,754
Purchase Details
Closed on
Jun 25, 2018
Sold by
Dustin A Schaffer
Bought by
Youngblut Travis and Roscovious Megahn
Home Financials for this Owner
Home Financials are based on the most recent Mortgage that was taken out on this home.
Original Mortgage
$106,400
Interest Rate
4.57%
Purchase Details
Closed on
Feb 17, 2012
Sold by
The Estate Of Joanne L Roberts and Even Sherry
Bought by
Schaffer Dustin A
Home Financials for this Owner
Home Financials are based on the most recent Mortgage that was taken out on this home.
Original Mortgage
$122,400
Interest Rate
3.87%
Mortgage Type
New Conventional
Create a Home Valuation Report for This Property
The Home Valuation Report is an in-depth analysis detailing your home's value as well as a comparison with similar homes in the area
Home Values in the Area
Average Home Value in this Area
Purchase History
| Date | Buyer | Sale Price | Title Company |
|---|---|---|---|
| Harken Alexander J | $160,000 | Roberts & Eddy Pc | |
| Youngblut Travis | -- | -- | |
| Schaffer Dustin A | $120,000 | None Available |
Source: Public Records
Mortgage History
| Date | Status | Borrower | Loan Amount |
|---|---|---|---|
| Open | Harken Alexander J | $128,000 | |
| Previous Owner | Youngblut Travis | $106,400 | |
| Previous Owner | Youngblut Travis | -- | |
| Previous Owner | Schaffer Dustin A | $122,400 | |
| Closed | Harken Alexander J | $32,000 |
Source: Public Records
Tax History Compared to Growth
Tax History
| Year | Tax Paid | Tax Assessment Tax Assessment Total Assessment is a certain percentage of the fair market value that is determined by local assessors to be the total taxable value of land and additions on the property. | Land | Improvement |
|---|---|---|---|---|
| 2025 | $2,788 | $176,040 | $21,950 | $154,090 |
| 2024 | $2,788 | $152,410 | $19,600 | $132,810 |
| 2023 | $2,708 | $152,410 | $19,600 | $132,810 |
| 2022 | $2,488 | $122,600 | $15,550 | $107,050 |
| 2021 | $2,440 | $122,600 | $15,550 | $107,050 |
| 2020 | $2,440 | $113,490 | $14,260 | $99,230 |
| 2019 | $2,268 | $113,490 | $14,260 | $99,230 |
| 2018 | $1,972 | $105,050 | $14,260 | $90,790 |
| 2017 | $1,982 | $105,050 | $14,260 | $90,790 |
| 2016 | $1,934 | $103,640 | $9,640 | $94,000 |
| 2015 | $1,934 | $103,640 | $9,640 | $94,000 |
| 2014 | $1,964 | $103,640 | $9,640 | $94,000 |
Source: Public Records
Map
Nearby Homes