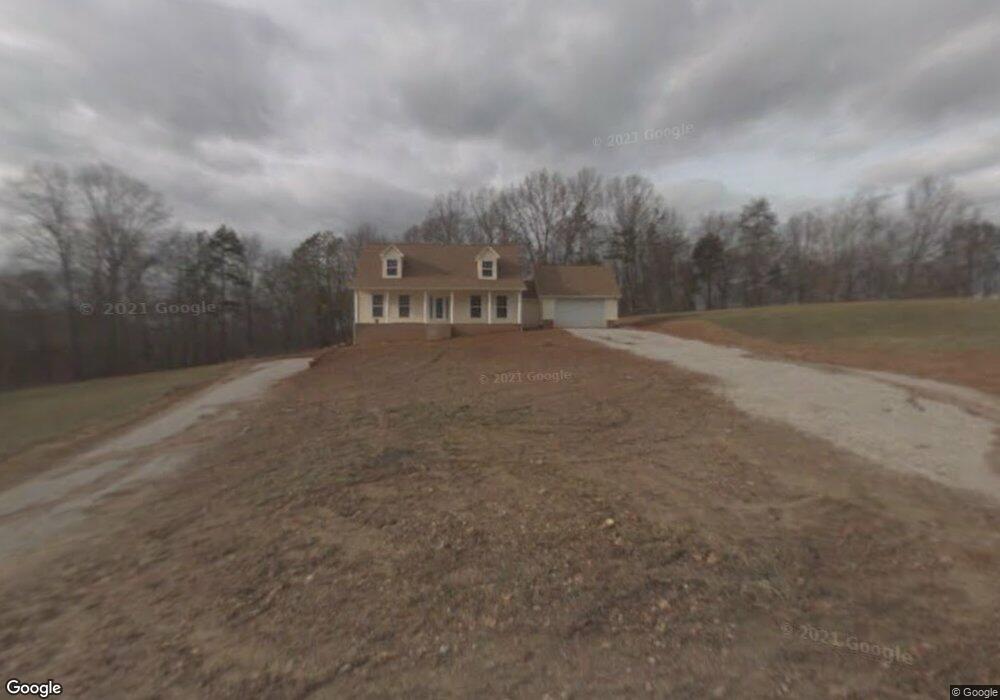
125 Blue Jay Ln Rutledge, TN 37861
Estimated Value: $323,000 - $594,000
3
Beds
3
Baths
1,848
Sq Ft
$247/Sq Ft
Est. Value
About This Home
This home is located at 125 Blue Jay Ln, Rutledge, TN 37861 and is currently estimated at $457,250, approximately $247 per square foot. 125 Blue Jay Ln is a home located in Grainger County with nearby schools including Rutledge Primary School, Rutledge Elementary School, and Rutledge Middle School.
Ownership History
Date
Name
Owned For
Owner Type
Purchase Details
Closed on
Nov 30, 2020
Sold by
Byrd Carl L and Byrd Sherry Clifton
Bought by
Hurd Jason N and Hurd Angela R
Current Estimated Value
Home Financials for this Owner
Home Financials are based on the most recent Mortgage that was taken out on this home.
Original Mortgage
$246,905
Outstanding Balance
$219,710
Interest Rate
2.8%
Mortgage Type
New Conventional
Estimated Equity
$237,540
Purchase Details
Closed on
Aug 26, 2014
Sold by
Jpmorgan Chase Bank Na
Bought by
Byrd Carl L and Byrd Sherry Clifton
Purchase Details
Closed on
Oct 24, 2013
Sold by
Minnich Lucas
Bought by
Jpmorgan Chase Bank National A
Purchase Details
Closed on
May 9, 2011
Sold by
Gilliam Danny
Bought by
Minnich Lucas A and Minnich Danielle C
Home Financials for this Owner
Home Financials are based on the most recent Mortgage that was taken out on this home.
Original Mortgage
$186,528
Interest Rate
4.85%
Mortgage Type
Commercial
Purchase Details
Closed on
Jan 13, 2006
Bought by
Harrison T J
Create a Home Valuation Report for This Property
The Home Valuation Report is an in-depth analysis detailing your home's value as well as a comparison with similar homes in the area
Home Values in the Area
Average Home Value in this Area
Purchase History
| Date | Buyer | Sale Price | Title Company |
|---|---|---|---|
| Hurd Jason N | $259,900 | Lakeway Title Services | |
| Byrd Carl L | $100,000 | -- | |
| Jpmorgan Chase Bank National A | $140,250 | -- | |
| Minnich Lucas A | $185,000 | -- | |
| Harrison T J | $100 | -- |
Source: Public Records
Mortgage History
| Date | Status | Borrower | Loan Amount |
|---|---|---|---|
| Open | Hurd Jason N | $246,905 | |
| Previous Owner | Minnich Lucas A | $186,528 |
Source: Public Records
Tax History Compared to Growth
Tax History
| Year | Tax Paid | Tax Assessment Tax Assessment Total Assessment is a certain percentage of the fair market value that is determined by local assessors to be the total taxable value of land and additions on the property. | Land | Improvement |
|---|---|---|---|---|
| 2025 | $1,635 | $69,575 | $0 | $0 |
| 2024 | $1,635 | $69,575 | $14,475 | $55,100 |
| 2023 | $1,635 | $69,575 | $14,475 | $55,100 |
| 2022 | $1,598 | $69,575 | $14,475 | $55,100 |
| 2021 | $1,598 | $69,575 | $14,475 | $55,100 |
| 2020 | $1,140 | $69,575 | $14,475 | $55,100 |
| 2019 | $1,140 | $40,700 | $6,000 | $34,700 |
| 2018 | $985 | $40,700 | $6,000 | $34,700 |
| 2017 | $985 | $40,700 | $6,000 | $34,700 |
| 2016 | $985 | $40,700 | $6,000 | $34,700 |
| 2015 | $971 | $40,700 | $6,000 | $34,700 |
| 2014 | $971 | $38,856 | $0 | $0 |
Source: Public Records
Map
Nearby Homes
- Lot 1 Cherokee Cove
- 248 Cherokee Cove
- 50 Cherokee Cove
- 48 Cherokee Cove
- Lot 2 Cherokee Cove Estates
- 322 Blount Cir
- 12 Rolling Hills
- 5 Rolling Hills
- 14 Rolling Hills
- 451 Blount Cir
- 0 Ostrich Ln Unit 9980166
- 0 Ostrich Ln Unit 1300806
- 0 Ostrich Ln Unit 707569
- 487 Peninsula Pointe
- 230 Water Way Dr
- 1518 Grainger Crossing
- Lot 2 Baye Rd
- 199 Chippewa Ln
- 153 Washita Ln
- 235 Chippewa Ln
- Lot 19 Cherokee Cove Dr
- Lot 33 Cherokee Cove
- Lot 41 Cherokee Cove
- Lot 42 Cherokee Cove
- Lot 47 Cherokee Cove
- 0 Cherkee Cove Unit 606553
- 27 Bluejay Ln
- 0 Cherokee Cove Unit 578663
- 0 Cherokee Cove Unit 576519
- 0 Cherokee Cove Unit 1247506
- 0 Cherokee Cove Unit 402755
- 0 Cherokee Cove Unit 378480
- 0 Cherokee Cove Unit 608363
- 0 Cherokee Cove Unit 608362
- 0 Cherokee Cove Unit 650089
- 0 Cherokee Cove Unit 695556
- 0 Cherokee Cove Unit 719716
- 0 Cherokee Cove Unit 933271
- 0 Cherokee Cove Unit 967846
- 0 Cherokee Cove Unit 1027743