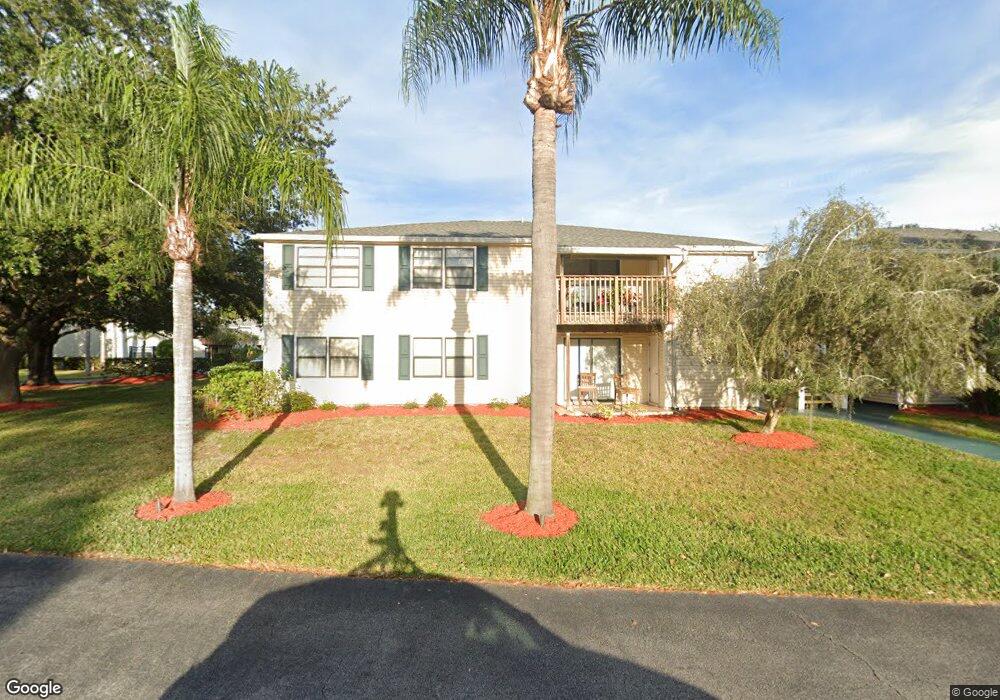
125 Camphor Cir Unit 1C Oldsmar, FL 34677
Estimated Value: $150,666 - $175,000
2
Beds
2
Baths
915
Sq Ft
$175/Sq Ft
Est. Value
About This Home
This home is located at 125 Camphor Cir Unit 1C, Oldsmar, FL 34677 and is currently estimated at $159,917, approximately $174 per square foot. 125 Camphor Cir Unit 1C is a home located in Pinellas County with nearby schools including Forest Lakes Elementary School, East Lake High School, and Joseph L. Carwise Middle School.
Ownership History
Date
Name
Owned For
Owner Type
Purchase Details
Closed on
Jan 30, 2018
Sold by
Michael Guarncri and Michael Michele Guarncri
Bought by
Santiago Jose and Acost Marlin Escahi
Current Estimated Value
Home Financials for this Owner
Home Financials are based on the most recent Mortgage that was taken out on this home.
Original Mortgage
$80,000
Outstanding Balance
$67,195
Interest Rate
3.94%
Mortgage Type
New Conventional
Estimated Equity
$92,722
Purchase Details
Closed on
Nov 21, 2014
Sold by
Nagel Barbara L
Bought by
Guarneri Michael and Guarneri Michele
Purchase Details
Closed on
Mar 31, 1998
Sold by
Barber Gail A
Bought by
Nagel Barbara L
Home Financials for this Owner
Home Financials are based on the most recent Mortgage that was taken out on this home.
Original Mortgage
$38,950
Interest Rate
7.01%
Mortgage Type
New Conventional
Create a Home Valuation Report for This Property
The Home Valuation Report is an in-depth analysis detailing your home's value as well as a comparison with similar homes in the area
Home Values in the Area
Average Home Value in this Area
Purchase History
| Date | Buyer | Sale Price | Title Company |
|---|---|---|---|
| Santiago Jose | $106,000 | Star Title Partners Of Palm | |
| Guarneri Michael | $63,000 | Total Title Solutions | |
| Nagel Barbara L | $41,000 | -- |
Source: Public Records
Mortgage History
| Date | Status | Borrower | Loan Amount |
|---|---|---|---|
| Open | Santiago Jose | $80,000 | |
| Previous Owner | Nagel Barbara L | $38,950 |
Source: Public Records
Tax History Compared to Growth
Tax History
| Year | Tax Paid | Tax Assessment Tax Assessment Total Assessment is a certain percentage of the fair market value that is determined by local assessors to be the total taxable value of land and additions on the property. | Land | Improvement |
|---|---|---|---|---|
| 2025 | $2,536 | $163,067 | -- | $163,067 |
| 2024 | $2,441 | $164,053 | -- | $164,053 |
| 2023 | $2,441 | $164,540 | $0 | $164,540 |
| 2022 | $2,256 | $153,314 | $0 | $153,314 |
| 2021 | $1,937 | $105,175 | $0 | $0 |
| 2020 | $1,901 | $101,742 | $0 | $0 |
| 2019 | $1,762 | $93,478 | $0 | $93,478 |
| 2018 | $1,206 | $73,414 | $0 | $0 |
| 2017 | $1,128 | $68,381 | $0 | $0 |
| 2016 | $940 | $47,924 | $0 | $0 |
| 2015 | $949 | $47,268 | $0 | $0 |
| 2014 | $238 | $36,794 | $0 | $0 |
Source: Public Records
Map
Nearby Homes
- 128 Camphor Cir Unit C
- 209 Corkwood Ln
- 134 Sycamore Ln Unit H
- 211 Corkwood Ln
- 215 Corkwood Ln
- 1206 Sawgrass Ct
- 271 Hemingway Dr
- 440 Lakeview Dr
- 412 Pinewood Dr
- 1637 Gray Bark Dr
- 1627 Shady Oaks Dr
- 1751 Split Fork Dr
- 106 Cutlass Way
- 382 Rosalind Ln
- 380 Rosalind Ln
- 311 Vista Cruiser Ln
- 403 E Tuscan Ln E
- 814 Satinleaf Ave
- 260 Balsam Dr
- 30 Aster Place
- 125 Camphor Cir Unit F
- 125 Camphor Cir Unit D
- 125 Camphor Cir
- 125 Camphor Cir Unit 1F
- 125 Camphor Cir Unit 1E
- 125 Camphor Cir Unit B
- 125 Camphor Cir Unit 1B
- 125 Camphor Cir Unit A
- 125 Camphor Cir Unit 1H
- 125 Camphor Cir Unit C
- 135 Camphor Cir
- 206 Corkwood Ln
- 204 Corkwood Ln
- 127 Camphor Cir Unit A
- 127 Camphor Cir Unit A
- 127 Camphor Cir Unit C
- 127 Camphor Cir Unit 2G
- 127 Camphor Cir Unit F
- 127 Camphor Cir Unit 20E
- 127 Camphor Cir Unit 2D