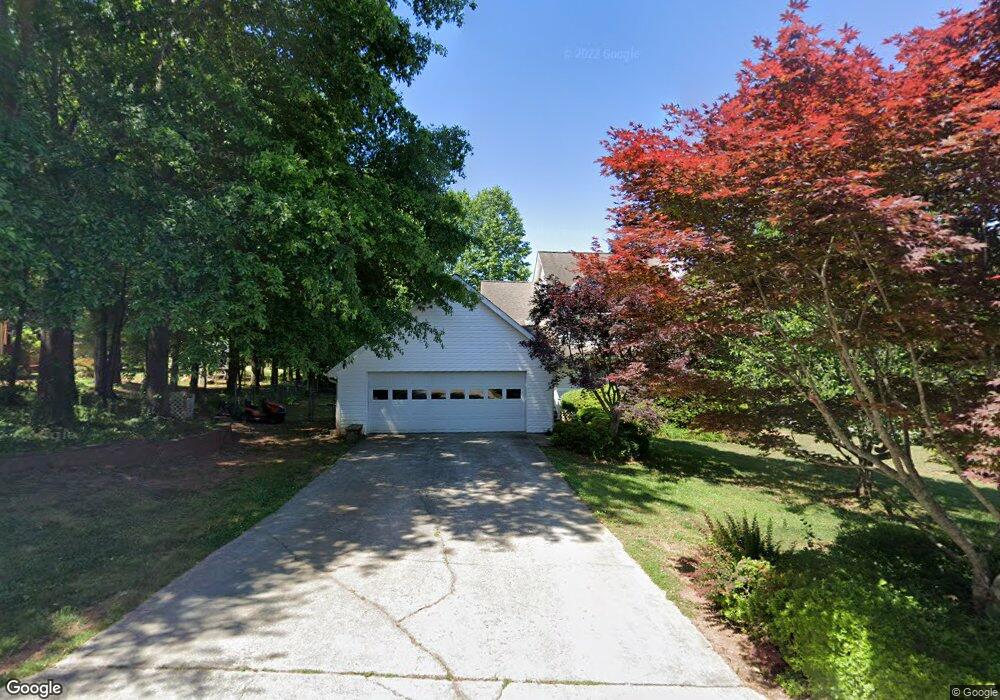
125 Chase Summit Ln Cornelia, GA 30531
Estimated Value: $352,000 - $421,000
4
Beds
3
Baths
2,086
Sq Ft
$182/Sq Ft
Est. Value
About This Home
This home is located at 125 Chase Summit Ln, Cornelia, GA 30531 and is currently estimated at $379,051, approximately $181 per square foot. 125 Chase Summit Ln is a home located in Habersham County with nearby schools including Cornelia Elementary School, Habersham Success Academy, and Wilbanks Middle School.
Ownership History
Date
Name
Owned For
Owner Type
Purchase Details
Closed on
Jun 9, 2020
Sold by
Gomley April
Bought by
Henriques Yurii and Henriques Heather P
Current Estimated Value
Home Financials for this Owner
Home Financials are based on the most recent Mortgage that was taken out on this home.
Original Mortgage
$180,000
Outstanding Balance
$159,556
Interest Rate
3.2%
Mortgage Type
New Conventional
Estimated Equity
$219,495
Purchase Details
Closed on
Jun 5, 2020
Sold by
Brown Joshua
Bought by
Gormley April
Home Financials for this Owner
Home Financials are based on the most recent Mortgage that was taken out on this home.
Original Mortgage
$180,000
Outstanding Balance
$159,556
Interest Rate
3.2%
Mortgage Type
New Conventional
Estimated Equity
$219,495
Purchase Details
Closed on
Apr 14, 2017
Sold by
Tench Maxine
Bought by
Gormley April and Brown Joshua
Home Financials for this Owner
Home Financials are based on the most recent Mortgage that was taken out on this home.
Original Mortgage
$178,686
Interest Rate
4.3%
Mortgage Type
New Conventional
Create a Home Valuation Report for This Property
The Home Valuation Report is an in-depth analysis detailing your home's value as well as a comparison with similar homes in the area
Home Values in the Area
Average Home Value in this Area
Purchase History
| Date | Buyer | Sale Price | Title Company |
|---|---|---|---|
| Henriques Yurii | $225,000 | -- | |
| Gormley April | -- | -- | |
| Gormley April | $176,900 | -- |
Source: Public Records
Mortgage History
| Date | Status | Borrower | Loan Amount |
|---|---|---|---|
| Open | Henriques Yurii | $180,000 | |
| Previous Owner | Gormley April | $178,686 |
Source: Public Records
Tax History Compared to Growth
Tax History
| Year | Tax Paid | Tax Assessment Tax Assessment Total Assessment is a certain percentage of the fair market value that is determined by local assessors to be the total taxable value of land and additions on the property. | Land | Improvement |
|---|---|---|---|---|
| 2025 | $2,537 | $132,211 | $12,000 | $120,211 |
| 2024 | -- | $134,752 | $12,000 | $122,752 |
| 2023 | $1,987 | $113,476 | $12,000 | $101,476 |
| 2022 | $2,349 | $99,028 | $12,000 | $87,028 |
| 2021 | $2,219 | $85,492 | $8,000 | $77,492 |
| 2020 | $1,952 | $72,584 | $6,000 | $66,584 |
| 2019 | $1,954 | $72,584 | $6,000 | $66,584 |
| 2018 | $1,890 | $70,760 | $6,000 | $64,760 |
| 2017 | $724 | $66,608 | $6,000 | $60,608 |
| 2016 | $661 | $166,520 | $6,000 | $60,608 |
| 2015 | $638 | $166,520 | $6,000 | $60,608 |
| 2014 | $628 | $162,240 | $6,000 | $58,896 |
| 2013 | -- | $64,896 | $6,000 | $58,896 |
Source: Public Records
Map
Nearby Homes
- 820 Camp Creek Rd
- 1576 Chase Rd
- 133 Hillandale St
- 240 Sugar Maple Dr
- 680 Elrod St
- 310 Wilson Rd
- 221 Mcallister Rd
- 147 Gibson St
- 421 Chase Cir
- 254 Oakdale Dr
- 0 Furniture Dr Unit 10484163
- 0 Furniture Dr Unit 7545752
- 166 Towerview Cir
- 2894 Chase Rd
- 0 Pet Care Ct Unit 10430326
- 296 Grand Ave
- 600 Hoyt St
- 26/27 Hoyt St
- 192 Summit St
- 246 Burrell St
- 151 Chase Summit Ln
- 0 Homeward Way Ln Unit 6 8045318
- 187 Chase Summit Ln
- 211 Homeward Way Ln Unit B
- 211 Homeward Way Ln Unit A
- 211 Homeward Way Ln
- 709 Camp Creek Rd
- 150 Chase Summit Ln
- 215 Chase Summit Ln
- 179 Homeward Way Ln Unit 6
- 179 Homeward Way Ln
- 186 Chase Summit Ln
- 640 Camp Creek Rd
- 145 Homeward Way Ln
- 218 Chase Summit Ln
- 193 Ridgeway Cir
- 221 Chase Summit Ln
- 179 Ridgeway Cir
- 619 Camp Creek Rd
- 828 Camp Creek Rd