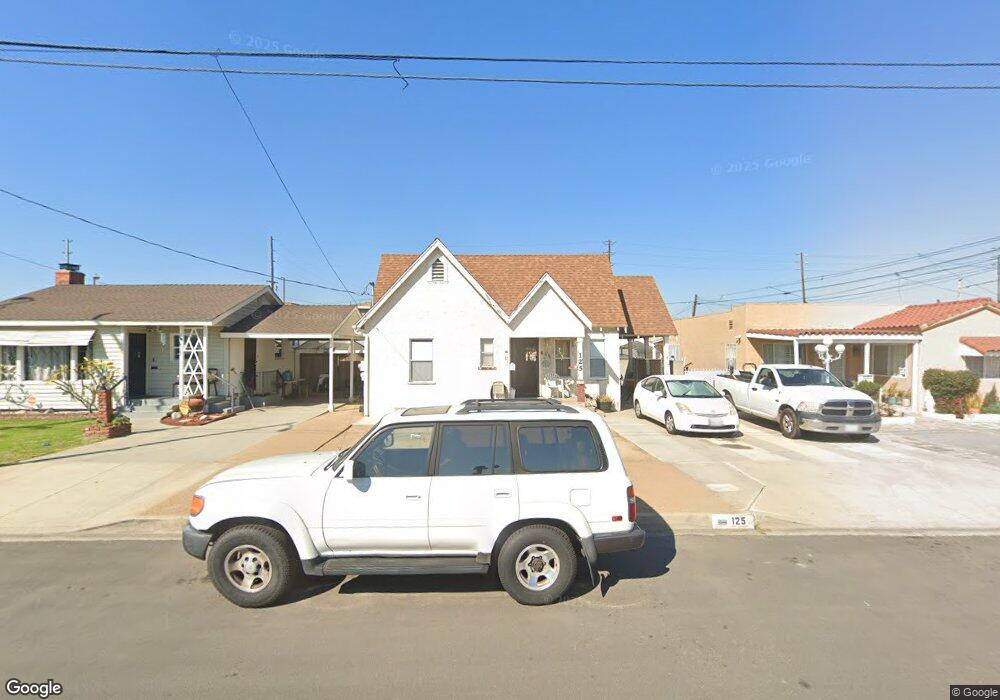
125 E Don St Wilmington, CA 90744
Estimated Value: $661,701 - $718,000
2
Beds
1
Bath
1,134
Sq Ft
$604/Sq Ft
Est. Value
About This Home
This home is located at 125 E Don St, Wilmington, CA 90744 and is currently estimated at $685,425, approximately $604 per square foot. 125 E Don St is a home located in Los Angeles County with nearby schools including Broad Avenue Elementary School, Wilmington Middle School STEAM Magnet, and Phineas Banning Senior High School.
Ownership History
Date
Name
Owned For
Owner Type
Purchase Details
Closed on
Oct 26, 2020
Sold by
Guessman Garth E and Guessman Corilyn J
Bought by
Guessman Garth E and Guessman Corilyn
Current Estimated Value
Home Financials for this Owner
Home Financials are based on the most recent Mortgage that was taken out on this home.
Original Mortgage
$166,000
Outstanding Balance
$118,618
Interest Rate
2.3%
Mortgage Type
New Conventional
Estimated Equity
$566,807
Purchase Details
Closed on
Oct 16, 2014
Sold by
Guessman Garth E
Bought by
The Garth & Corilyn Guessman Living Trus
Purchase Details
Closed on
May 27, 1994
Sold by
Scott Thomas A and Scott Deloris
Bought by
Guessman Garth E
Home Financials for this Owner
Home Financials are based on the most recent Mortgage that was taken out on this home.
Original Mortgage
$125,850
Interest Rate
8.57%
Create a Home Valuation Report for This Property
The Home Valuation Report is an in-depth analysis detailing your home's value as well as a comparison with similar homes in the area
Home Values in the Area
Average Home Value in this Area
Purchase History
| Date | Buyer | Sale Price | Title Company |
|---|---|---|---|
| Guessman Garth E | -- | Pacific Coast Title Company | |
| Guessman Garth E | -- | Pacific Coast Title Company | |
| The Garth & Corilyn Guessman Living Trus | -- | None Available | |
| Guessman Garth E | $140,000 | Orange Coast Title | |
| Scott Thomas A | -- | Orange Coast Title | |
| Scott Thomas A | -- | Orange Coast Title |
Source: Public Records
Mortgage History
| Date | Status | Borrower | Loan Amount |
|---|---|---|---|
| Open | Guessman Garth E | $166,000 | |
| Previous Owner | Guessman Garth E | $125,850 |
Source: Public Records
Tax History
| Year | Tax Paid | Tax Assessment Tax Assessment Total Assessment is a certain percentage of the fair market value that is determined by local assessors to be the total taxable value of land and additions on the property. | Land | Improvement |
|---|---|---|---|---|
| 2025 | $2,954 | $235,126 | $139,401 | $95,725 |
| 2024 | $2,954 | $230,517 | $136,668 | $93,849 |
| 2023 | $2,899 | $225,998 | $133,989 | $92,009 |
| 2022 | $2,768 | $221,567 | $131,362 | $90,205 |
| 2021 | $2,729 | $217,224 | $128,787 | $88,437 |
| 2019 | $2,648 | $210,783 | $124,968 | $85,815 |
| 2018 | $2,585 | $206,651 | $122,518 | $84,133 |
| 2016 | $2,460 | $198,628 | $117,761 | $80,867 |
| 2015 | $2,425 | $195,646 | $115,993 | $79,653 |
| 2014 | $2,440 | $191,814 | $113,721 | $78,093 |
Source: Public Records
Map
Nearby Homes
- 1526 Lakme Ave
- 1611 Bay View Ave
- 624 E Pacific St
- 832 E Pacific St
- 1405 Lagoon Ave
- 1341 N Fries Ave
- 1644 N Wilmington Blvd
- 1262 N Lagoon Ave
- 1446 Gulf Ave
- 41 Scottsdale S
- 11 Eastridge Ln
- 23616 Panama Ave
- 2 Jackrabbit Ln
- 1138 N Banning Blvd
- 1306 Gulf Ave
- 1207 Bay View Ave
- 1128 W Dolores St
- 703 W L St
- 40 Camelback Ave S Unit 46
- 1301 E Pacific Coast Hwy
- 121 E Don St
- 129 E Don St
- 622 E Lomita Blvd
- 618 E Lomita Blvd
- 628 E Lomita Blvd
- 1737 Broad Ave
- 1733 Broad Ave
- 1741 Broad Ave
- 614 E Lomita Blvd
- 1745 Broad Ave
- 1747 Broad Ave
- 124 E Don St
- 128 E Don St
- 120 E Don St
- 140 E Don St
- 116 E Don St
- 1748 N Avalon Blvd
- 1731 Broad Ave
- 1727 Broad Ave
- 1721 Broad Ave
Your Personal Tour Guide
Ask me questions while you tour the home.