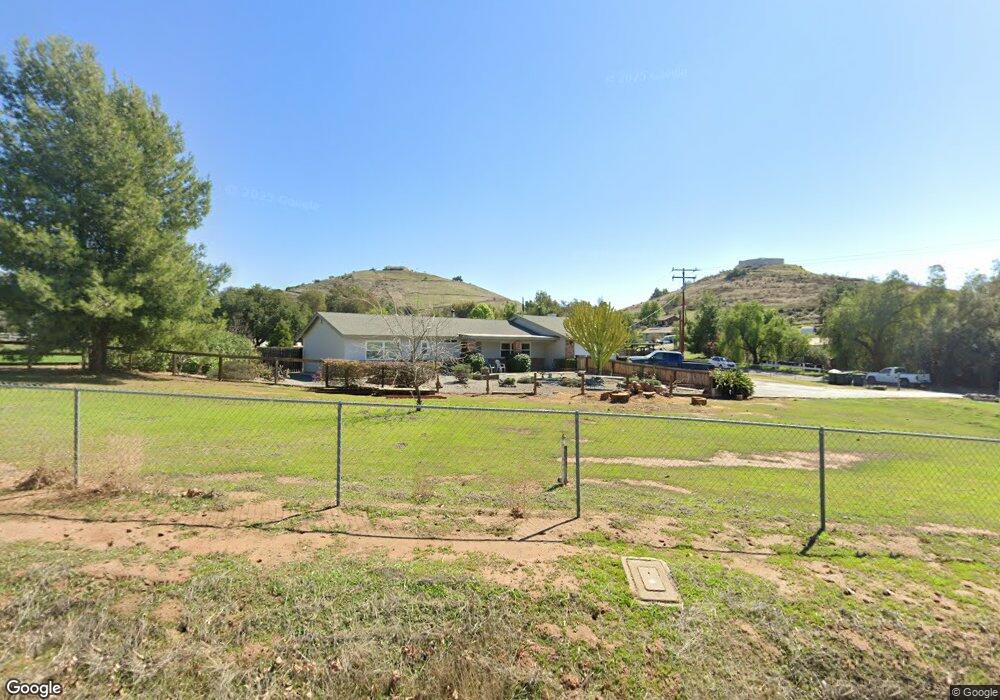
125 E Old Julian Hwy Ramona, CA 92065
Estimated Value: $761,537 - $848,000
3
Beds
2
Baths
1,792
Sq Ft
$452/Sq Ft
Est. Value
About This Home
This home is located at 125 E Old Julian Hwy, Ramona, CA 92065 and is currently estimated at $810,634, approximately $452 per square foot. 125 E Old Julian Hwy is a home located in San Diego County with nearby schools including Ramona Elementary School, Olive Peirce Middle School, and Ramona High School.
Ownership History
Date
Name
Owned For
Owner Type
Purchase Details
Closed on
Dec 30, 2024
Sold by
Dennis Michelle Laurie
Bought by
Dennis Justin Eric
Current Estimated Value
Purchase Details
Closed on
Nov 1, 2024
Sold by
Dennis Eric E and Mae Cynthia
Bought by
Dennis Justin Eric and Dennis Eric E
Purchase Details
Closed on
Jul 23, 2012
Sold by
Dennis Eric E and Dennis Cynthia M
Bought by
Dennis Eric E and Dennis Cynthia Mae
Home Financials for this Owner
Home Financials are based on the most recent Mortgage that was taken out on this home.
Original Mortgage
$226,175
Interest Rate
3.5%
Mortgage Type
New Conventional
Purchase Details
Closed on
Jun 21, 1991
Bought by
Dennis Eric E Cynthia M
Purchase Details
Closed on
Jan 18, 1990
Create a Home Valuation Report for This Property
The Home Valuation Report is an in-depth analysis detailing your home's value as well as a comparison with similar homes in the area
Home Values in the Area
Average Home Value in this Area
Purchase History
| Date | Buyer | Sale Price | Title Company |
|---|---|---|---|
| Dennis Justin Eric | -- | None Listed On Document | |
| Dennis Justin Eric | -- | None Listed On Document | |
| Dennis Justin Eric | -- | None Listed On Document | |
| Dennis Justin Eric | -- | None Listed On Document | |
| Dennis Eric E | -- | North American Title Co | |
| Dennis Eric E Cynthia M | $180,000 | -- | |
| -- | $168,000 | -- |
Source: Public Records
Mortgage History
| Date | Status | Borrower | Loan Amount |
|---|---|---|---|
| Previous Owner | Dennis Eric E | $226,175 |
Source: Public Records
Tax History Compared to Growth
Tax History
| Year | Tax Paid | Tax Assessment Tax Assessment Total Assessment is a certain percentage of the fair market value that is determined by local assessors to be the total taxable value of land and additions on the property. | Land | Improvement |
|---|---|---|---|---|
| 2025 | $3,511 | $324,629 | $119,589 | $205,040 |
| 2024 | $3,511 | $318,265 | $117,245 | $201,020 |
| 2023 | $3,249 | $312,026 | $114,947 | $197,079 |
| 2022 | $3,388 | $305,909 | $112,694 | $193,215 |
| 2021 | $3,328 | $299,912 | $110,485 | $189,427 |
| 2020 | $3,295 | $296,838 | $109,353 | $187,485 |
| 2019 | $3,215 | $291,018 | $107,209 | $183,809 |
| 2018 | $3,130 | $285,312 | $105,107 | $180,205 |
| 2017 | $3,069 | $279,719 | $103,047 | $176,672 |
| 2016 | $3,009 | $274,235 | $101,027 | $173,208 |
| 2015 | $2,966 | $270,117 | $99,510 | $170,607 |
| 2014 | $2,899 | $264,827 | $97,561 | $167,266 |
Source: Public Records
Map
Nearby Homes
- 0 Mussey Grade Rd Unit B 220023313
- 0 Mussey Grade Rd Unit C 220023312
- 0 Hwy 78 (Julian Rd) Unit SW21092588
- 333 Salmon Rd
- 161 Steffy Rd
- 539 Steffy Rd
- 18434 Ramona View Dr
- 322 G St
- 1566 Wilson Rd
- 415 3rd St
- 1550 Keyes Rd
- 1608 Wilson Rd
- 0 Camino Arriba Unit 3 250034073
- 40 acres Sutherland Dam Rd
- 722 8th St
- VL Old Julian Hwy
- 18351 Woods Hill Ln
- 915 9th St
- 611 9th St
- 19630 Camino Vista Unit 191
- 132 W Old Julian Hwy
- 151 E Old Julian Hwy
- 907 Neighborly Ln
- 108 E Old Julian Hwy
- 136 E Old Julian Hwy
- 940 Neighborly Ln
- 124 E Old Julian Hwy
- 915 Neighborly Ln
- 205 E Old Julian Hwy
- 117 E Old Julian Hwy
- 132 E Old Julian Hwy
- 933 Neighborly Ln
- 120 W Old Julian Hwy
- 956 Neighborly Ln
- 725 Amigos Rd
- 881 Rykers Ridge Rd
- 160 Kristen Villa Ct
- 981 Neighborly Ln
- 0000 Hatfield Ln
- 985 Neighborly Ln