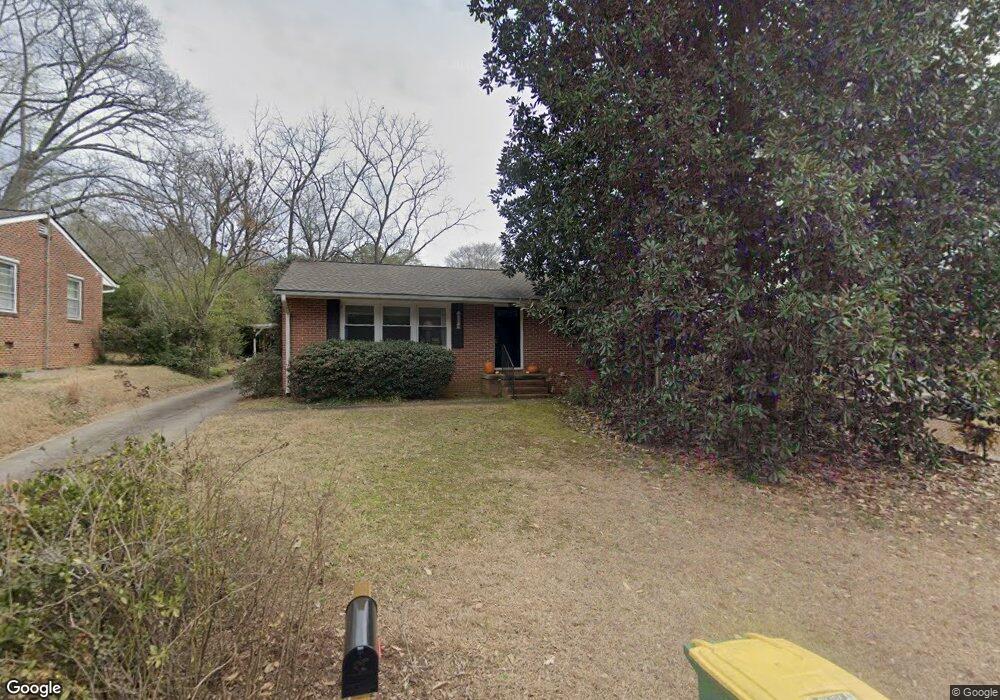
125 Edwards Cir Athens, GA 30606
Normaltown NeighborhoodEstimated Value: $346,000 - $381,000
3
Beds
1
Bath
1,025
Sq Ft
$354/Sq Ft
Est. Value
About This Home
This home is located at 125 Edwards Cir, Athens, GA 30606 and is currently estimated at $363,336, approximately $354 per square foot. 125 Edwards Cir is a home located in Clarke County with nearby schools including Johnnie Lay Burks Elementary School, Clarke Middle School, and Clarke Central High School.
Ownership History
Date
Name
Owned For
Owner Type
Purchase Details
Closed on
Nov 16, 2017
Sold by
Tingle Matthew D
Bought by
Birch Frost Llc
Current Estimated Value
Purchase Details
Closed on
Dec 28, 2010
Sold by
Greene Ansley M
Bought by
Tingle Matthew
Home Financials for this Owner
Home Financials are based on the most recent Mortgage that was taken out on this home.
Original Mortgage
$107,100
Interest Rate
4.48%
Mortgage Type
New Conventional
Purchase Details
Closed on
Apr 29, 2004
Sold by
Hopper Hopper C and Hopper Donna H
Bought by
Greene Ansley M
Purchase Details
Closed on
Dec 31, 1996
Sold by
Hogan Jane H and William Hopper C
Bought by
Hopp Hopper C and Hopp Donna H
Purchase Details
Closed on
Jan 1, 1995
Sold by
Mcwhorter W Ted
Bought by
Hogan Jane H and William Hopper C
Create a Home Valuation Report for This Property
The Home Valuation Report is an in-depth analysis detailing your home's value as well as a comparison with similar homes in the area
Home Values in the Area
Average Home Value in this Area
Purchase History
| Date | Buyer | Sale Price | Title Company |
|---|---|---|---|
| Birch Frost Llc | -- | -- | |
| Tingle Matthew | $119,000 | -- | |
| Greene Ansley M | $124,600 | -- | |
| Hopp Hopper C | -- | -- | |
| Hogan Jane H | -- | -- |
Source: Public Records
Mortgage History
| Date | Status | Borrower | Loan Amount |
|---|---|---|---|
| Previous Owner | Tingle Matthew | $107,100 |
Source: Public Records
Tax History Compared to Growth
Tax History
| Year | Tax Paid | Tax Assessment Tax Assessment Total Assessment is a certain percentage of the fair market value that is determined by local assessors to be the total taxable value of land and additions on the property. | Land | Improvement |
|---|---|---|---|---|
| 2025 | $4,373 | $140,849 | $44,000 | $96,849 |
| 2024 | $4,373 | $131,306 | $44,000 | $87,306 |
| 2023 | $4,103 | $122,731 | $40,000 | $82,731 |
| 2022 | $3,241 | $101,596 | $40,000 | $61,596 |
| 2021 | $3,112 | $92,344 | $40,000 | $52,344 |
| 2020 | $2,924 | $86,764 | $36,000 | $50,764 |
| 2019 | $2,550 | $75,104 | $30,000 | $45,104 |
| 2018 | $2,438 | $71,813 | $30,000 | $41,813 |
| 2017 | $2,179 | $64,178 | $30,000 | $34,178 |
| 2016 | $1,652 | $58,648 | $30,000 | $28,648 |
| 2015 | $1,514 | $54,517 | $26,000 | $28,517 |
| 2014 | $1,345 | $49,464 | $22,000 | $27,464 |
Source: Public Records
Map
Nearby Homes
- 115 Edwards Cir
- 135 Edwards Cir
- 275 Willow Run
- 265 Willow Run
- 145 Edwards Cir
- 285 Willow Run
- 105 Edwards Cir
- 120 Edwards Cir
- 110 Edwards Cir
- 245 Willow Run
- 130 Edwards Cir
- 295 Willow Run
- 100 Edwards Cir
- 235 Willow Run
- 140 Edwards Cir
- 155 Edwards Cir
- 260 Willow Run
- 250 Willow Run
- 85 Edwards Cir
- 270 Willow Run