125 Fairway Ln Unit 4 Hartwell, GA 30643
Estimated Value: $367,000 - $658,000
3
Beds
3
Baths
2,940
Sq Ft
$173/Sq Ft
Est. Value
About This Home
This home is located at 125 Fairway Ln Unit 4, Hartwell, GA 30643 and is currently estimated at $507,426, approximately $172 per square foot. 125 Fairway Ln Unit 4 is a home located in Hart County with nearby schools including Hart County High School, Goldmine Christian Academy, and Hartwell Mennonite School.
Ownership History
Date
Name
Owned For
Owner Type
Purchase Details
Closed on
Apr 27, 2018
Sold by
Leard Daniel D
Bought by
Miller Lindsay Gregory Brent and Miller Lindsay Kristi
Current Estimated Value
Home Financials for this Owner
Home Financials are based on the most recent Mortgage that was taken out on this home.
Original Mortgage
$212,000
Outstanding Balance
$182,707
Interest Rate
4.44%
Mortgage Type
New Conventional
Estimated Equity
$324,719
Purchase Details
Closed on
May 5, 2017
Sold by
Cornwell Hugh W
Bought by
Leard Daniel D
Home Financials for this Owner
Home Financials are based on the most recent Mortgage that was taken out on this home.
Original Mortgage
$189,000
Interest Rate
4.1%
Mortgage Type
New Conventional
Purchase Details
Closed on
Oct 17, 2013
Sold by
Cornwell Dorothy M
Bought by
Cornwell Hugh W
Purchase Details
Closed on
Feb 1, 1998
Purchase Details
Closed on
Jan 1, 1989
Create a Home Valuation Report for This Property
The Home Valuation Report is an in-depth analysis detailing your home's value as well as a comparison with similar homes in the area
Home Values in the Area
Average Home Value in this Area
Purchase History
| Date | Buyer | Sale Price | Title Company |
|---|---|---|---|
| Miller Lindsay Gregory Brent | $265,000 | -- | |
| Leard Daniel D | $210,000 | -- | |
| Cornwell Hugh W | -- | -- | |
| -- | $17,000 | -- | |
| -- | -- | -- |
Source: Public Records
Mortgage History
| Date | Status | Borrower | Loan Amount |
|---|---|---|---|
| Open | Miller Lindsay Gregory Brent | $212,000 | |
| Previous Owner | Leard Daniel D | $189,000 |
Source: Public Records
Tax History Compared to Growth
Tax History
| Year | Tax Paid | Tax Assessment Tax Assessment Total Assessment is a certain percentage of the fair market value that is determined by local assessors to be the total taxable value of land and additions on the property. | Land | Improvement |
|---|---|---|---|---|
| 2024 | $2,506 | $178,720 | $16,000 | $162,720 |
| 2023 | $2,347 | $155,936 | $16,000 | $139,936 |
| 2022 | $2,025 | $133,010 | $5,655 | $127,355 |
| 2021 | $2,004 | $119,514 | $3,056 | $116,458 |
| 2020 | $1,918 | $109,055 | $2,975 | $106,080 |
| 2019 | $2,064 | $105,600 | $2,975 | $102,625 |
| 2018 | $1,661 | $89,793 | $2,975 | $86,818 |
| 2017 | $1,768 | $88,930 | $2,975 | $85,955 |
| 2016 | $1,589 | $87,466 | $2,021 | $85,445 |
| 2015 | $1,758 | $90,276 | $2,522 | $87,754 |
| 2014 | $1,741 | $87,635 | $1,644 | $85,991 |
| 2013 | -- | $88,623 | $1,644 | $86,979 |
Source: Public Records
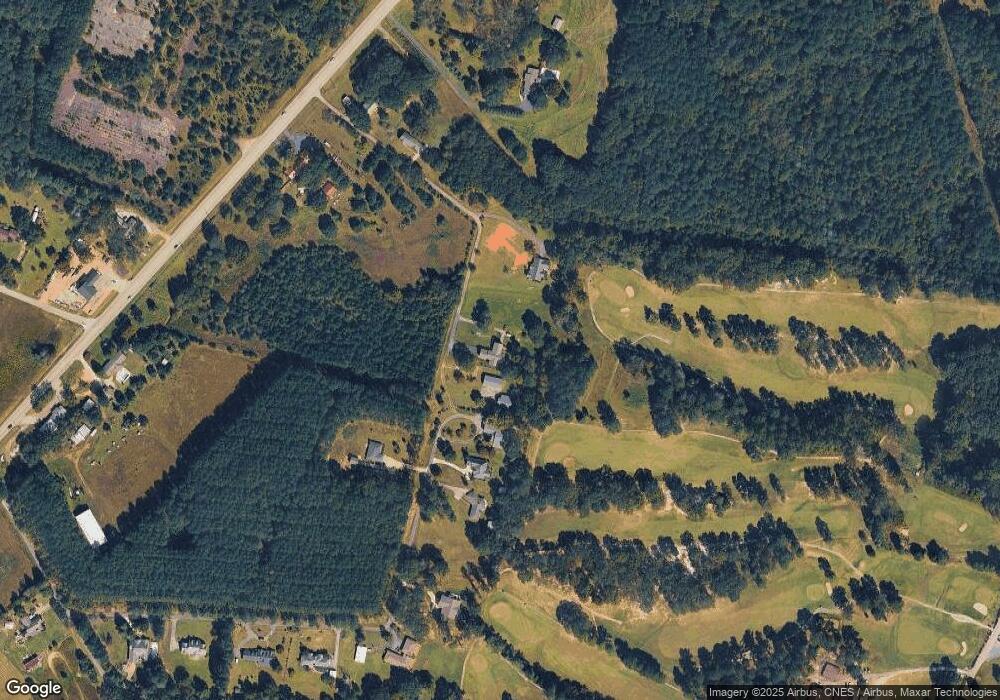
Map
Nearby Homes
- 782 Sunset Rd
- 712 Scott Mill Rd
- 744 Cherokee Ridge Rd
- 783 Athens St
- 835 Center of the World Rd
- 45 Dogwood St
- 169 Brown St
- 656 Highland Ave Unit LOT 5
- 638 Highland Ave
- 651 S Jackson St
- 0 Holly St Unit 10595836
- 72 Cade St
- 02 Bethany Bowersville Rd
- 01 Bethany Bowersville Rd
- 03 Bethany Bowersville Rd
- 05 Bethany Bowersville Rd
- 1528 Hodges Mill Rd
- TRACT 3 Seed Cleaner Rd
- TRACT 1 Seed Cleaner Rd
- TRACT 2 Seed Cleaner Rd
- 125 Fairway Ln
- 350 Golfview Dr
- 292 Golfview Dr
- 286 Golfview Dr
- 285 Golfview Dr
- 75 Fairway Ln
- 224 Golfview Dr
- 2071 Royston Hwy
- 2179 Royston Hwy
- 2179 Royston Hwy
- 27 Fairway Ln
- 2081 Royston Hwy
- 2188 Royston Hwy
- 194 Golfview Dr
- 2007 Royston Hwy
- 144 Golfview Dr
- 2345 Royston Hwy
- 106 Golfview Dr
- 2318 Royston Hwy
- 380 Spencer Ln