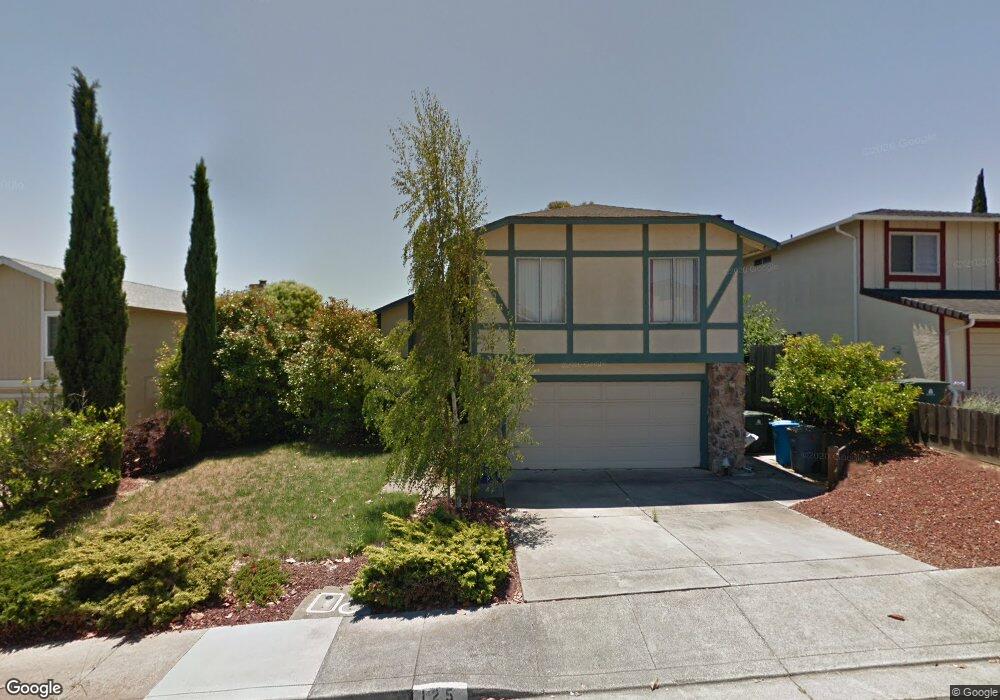
125 Flint Ct Vallejo, CA 94589
North Vallejo NeighborhoodEstimated Value: $475,000 - $616,000
4
Beds
3
Baths
1,824
Sq Ft
$289/Sq Ft
Est. Value
About This Home
This home is located at 125 Flint Ct, Vallejo, CA 94589 and is currently estimated at $527,269, approximately $289 per square foot. 125 Flint Ct is a home located in Solano County with nearby schools including Elsa Widenmann Elementary, Solano Middle School, and Vallejo High School.
Ownership History
Date
Name
Owned For
Owner Type
Purchase Details
Closed on
Apr 9, 2007
Sold by
Jackson Eldridge
Bought by
Jackson Eldridge
Current Estimated Value
Home Financials for this Owner
Home Financials are based on the most recent Mortgage that was taken out on this home.
Original Mortgage
$380,000
Outstanding Balance
$278,911
Interest Rate
10.5%
Mortgage Type
New Conventional
Estimated Equity
$248,358
Purchase Details
Closed on
Jan 12, 2006
Sold by
Jackson Melinda
Bought by
Jackson Eldridge
Home Financials for this Owner
Home Financials are based on the most recent Mortgage that was taken out on this home.
Original Mortgage
$318,500
Interest Rate
11.25%
Mortgage Type
New Conventional
Purchase Details
Closed on
Feb 20, 1997
Sold by
Emc Mtg Corp
Bought by
Jackson Eldridge and Jackson Melinda
Home Financials for this Owner
Home Financials are based on the most recent Mortgage that was taken out on this home.
Original Mortgage
$135,276
Interest Rate
7.9%
Mortgage Type
FHA
Purchase Details
Closed on
Jul 18, 1996
Sold by
Urbano Leonard V and Urbano Sedelita P
Bought by
Emc Mtg Corp
Create a Home Valuation Report for This Property
The Home Valuation Report is an in-depth analysis detailing your home's value as well as a comparison with similar homes in the area
Home Values in the Area
Average Home Value in this Area
Purchase History
| Date | Buyer | Sale Price | Title Company |
|---|---|---|---|
| Jackson Eldridge | -- | Old Republic Title Company | |
| Jackson Eldridge | -- | Alliance Title Co | |
| Jackson Eldridge | $139,500 | Fidelity National Title Co | |
| Emc Mtg Corp | $123,250 | -- |
Source: Public Records
Mortgage History
| Date | Status | Borrower | Loan Amount |
|---|---|---|---|
| Open | Jackson Eldridge | $380,000 | |
| Closed | Jackson Eldridge | $318,500 | |
| Closed | Jackson Eldridge | $135,276 |
Source: Public Records
Tax History
| Year | Tax Paid | Tax Assessment Tax Assessment Total Assessment is a certain percentage of the fair market value that is determined by local assessors to be the total taxable value of land and additions on the property. | Land | Improvement |
|---|---|---|---|---|
| 2025 | $4,942 | $227,202 | $73,290 | $153,912 |
| 2024 | $4,942 | $222,748 | $71,853 | $150,895 |
| 2023 | $4,646 | $218,382 | $70,445 | $147,937 |
| 2022 | $4,468 | $214,101 | $69,065 | $145,036 |
| 2021 | $4,370 | $209,904 | $67,711 | $142,193 |
| 2020 | $4,344 | $207,752 | $67,017 | $140,735 |
| 2019 | $3,842 | $203,679 | $65,703 | $137,976 |
| 2018 | $3,239 | $199,686 | $64,415 | $135,271 |
| 2017 | $2,986 | $195,771 | $63,152 | $132,619 |
| 2016 | $3,193 | $191,933 | $61,914 | $130,019 |
| 2015 | $3,163 | $189,050 | $60,984 | $128,066 |
| 2014 | $3,091 | $185,348 | $59,790 | $125,558 |
Source: Public Records
Map
Nearby Homes
- 475 Whitney Ave
- 243 Sage St
- 464 Evelyn Cir
- 408 Lakeside Dr
- 0 Antioch Dr
- 240 Parkview Terrace
- 355 Parkview Terrace Unit 2
- 355 Parkview Terrace Unit 7
- 355 Parkview Terrace Unit B9
- 355 Parkview Terrace Unit A-8
- 157 Haviture Way
- 120 Persimmon Dr
- 0 Fairgrounds Dr Unit 325101300
- 124 Erin Dr
- 147 Erin Dr
- 1457 N Camino Alto Unit 214
- 116 Encerti Ave
- 137 Hastings Ave
- 444 Corcoran Ave Unit 4
- 343 B W Williams Dr
Your Personal Tour Guide
Ask me questions while you tour the home.